Market Sessions
This is a powerful addition to your MetaTrader 5 toolkit designed to optimize market analysis and performance. This technical indicator acts as a specialized analysis tool designed to visualize market data. It helps traders identify emerging trends, momentum shifts, and key support or resistance levels by plotting statistical calculations directly onto price charts.
How to Setup and Use Market Sessions
1. Installation: Place your file in the MQL/Indicators folder via "Open Data Folder" and restart your terminal.
2. Loading: Find the indicator in the Navigator, drag it onto your chart, and configure the input parameters in the popup window.
3. Customization: Press Ctrl+I to open the indicator list, select your tool, and click "Properties" to change colors, levels, or visual styles.
4. Updating: Replace the old file in the Indicators folder with the new version and restart the platform to apply changes.
Frequently Asked Questions
Q: Why is my indicator not showing? A: Verify the file is in the MQL/Indicators folder, or try right-clicking the "Indicators" tree in the Navigator and clicking "Refresh."
Q: Do custom indicators slow down the platform? A: Too many complex indicators can impact performance; remove unused ones via the "Indicator List" (Ctrl+I).
Q: Can I use MT4 indicators on MT5? A: No, MQL4 and MQL5 are distinct languages; ensure the indicator is compiled specifically for your platform version.
Description & Settings
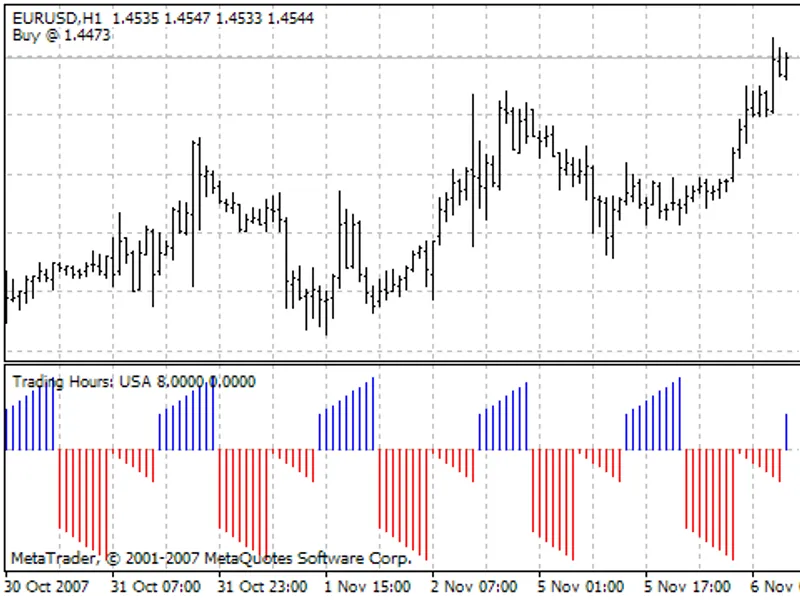
Indicator Market Session displays on the price chart trading session in New york, London, Tokyo, and Sydney. You can specify the start and end hours of each trading session manually.
It has eighteen adjustable parameters:
Sidney session begin
- Sydney trading session start hour
Sidney session end
- Sydney trading session end hour
Sidney session color
- Sydney trading session area color on the price chart
Tokio session begin
- Tokyo trading session start hour
Tokio session end
- Tokyo trading session end hour
Tokio session color
- Tokyo trading session area color on the price chart
London session begin
- London trading session start hour
London session end
- London trading session end hour
London session color
- London trading session area color on the price chart
NewYork session begin
- New York trading session start hour
NewYork session end
- New York trading session end hour
NewYork session color
- New York trading session area color on the price chart
Session field height
- trading session area height (in points) on the price chart
Show session labels
- show the names of trading sessions within the session area on the price chart (Yes/No)
Font name
- trading session label font name
Font size
- trading session label font size
Font color
- trading session label font color
Show start-session lines
- show the lines of each trading session start on the price chart (Yes/No)
The indicator can only work on the charts with the timeframe of H1 or lower. As soon as you switch to a higher timeframe, the indicator will warn you and switch back to the hourly chart.