


Hikkake Pattern (Inside Day False Breakout)
Info
The Hikkake Pattern (Inside Day False Breakout) is a Indicator for MetaTrader 5 that hikkake pattern (inside day false breakout) indicator is a trading strategy based on false breakouts. Translated into MQL5 code from Dan Chesler's article published in April 2004, Active Trader Magazine "Trading False Moves with the Hikkake Pattern".
Usage
This tool is typically used for breakout trading when price moves beyond key support/resistance levels.
Platform
This Indicator works exclusively on MetaTrader 5 (both build 600+ and newer versions).
Setup
Place the downloaded file in MQL5/Indicators folder via File ? Open Data Folder in MetaTrader 5.
How to Install and Use Hikkake Pattern (Inside Day False Breakout)
1. Installation: Place your file in the MQL/Indicators folder via "Open Data Folder" and restart your terminal.
2. Loading: Find the indicator in the Navigator, drag it onto your chart, and configure the input parameters in the popup window.
3. Customization: Press Ctrl+I to open the indicator list, select your tool, and click "Properties" to change colors, levels, or visual styles.
4. Updating: Replace the old file in the Indicators folder with the new version and restart the platform to apply changes.
Frequently Asked Questions
Q: Why is my indicator not showing? A: Verify the file is in the MQL/Indicators folder, or try right-clicking the "Indicators" tree in the Navigator and clicking "Refresh."
Q: Do custom indicators slow down the platform? A: Too many complex indicators can impact performance; remove unused ones via the "Indicator List" (Ctrl+I).
Q: Can I use MT4 indicators on MT5? A: No, MQL4 and MQL5 are distinct languages; ensure the indicator is compiled specifically for your platform version.
What this tool does
Hikkake Pattern (Inside Day False Breakout) indicator is a trading strategy based on false breakouts.
Typical Use Case
This Indicator excels in automated trading and technical analysis on MetaTrader 5.
Compatible Platform & Setup
This Indicator works on MetaTrader 5. Place the file in the MQL5/Indicators folder and restart the terminal.
Description & Settings
Related: Demo Buffer Pattern Indicator - another powerful indicator for MetaTrader 5 traders.
Hikkake Pattern (Inside Day False Breakout) indicator is a trading strategy based on false breakouts. Translated into MQL5 code from Dan Chesler's article published in April 2004, Active Trader Magazine "Trading False Moves with the Hikkake Pattern".
Also recommended: Nonparametric Zig Zag, A-la Clyde Lee Patterns - similar indicator with strong performance on MetaTrader 5.
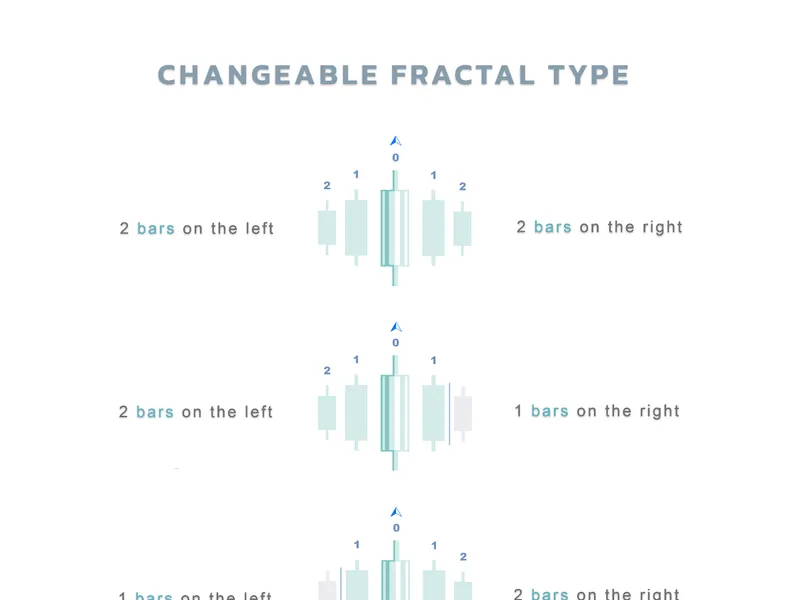
The basic Hikkake pattern consists of two price bars — two hourly bars, two daily bars, two weekly bars, etc. The first bar in the pattern is an inside bar, which is simply a bar with a lower high and higher low than the preceding bar. The second bar in the pattern must have a higher high and higher low than the previous (inside) bar for a bearish Hikkake setup, or a lower low and a lower high than the previous (inside) bar for a bullish Hikkake setup.The essence of the pattern concept is captured in these two bars. The market has just broken out from an inside bar. Traders are positioned to go with the market in the direction of the breakout.
However, just as an athlete will execute a well-timed stutter step to throw off an opponent, so does the market. The market’s true intent becomes clear only after it begins moving in a direction opposite that of the initial breakout. As with all patterns, it is important to wait for signs of verification before acting.
With the Hikkake pattern, a false move should not be anticipated unless price crosses above the high of the inside bar (for a bullish setup) or below the low of the inside bar (for a bearish setup). Verification must occur within three bars of the Hikkake pattern, otherwise the pattern is ignored.
Dan Chesler
Complete Dan Chesler article:
We developed this indicator from scratch following Dan's theory.
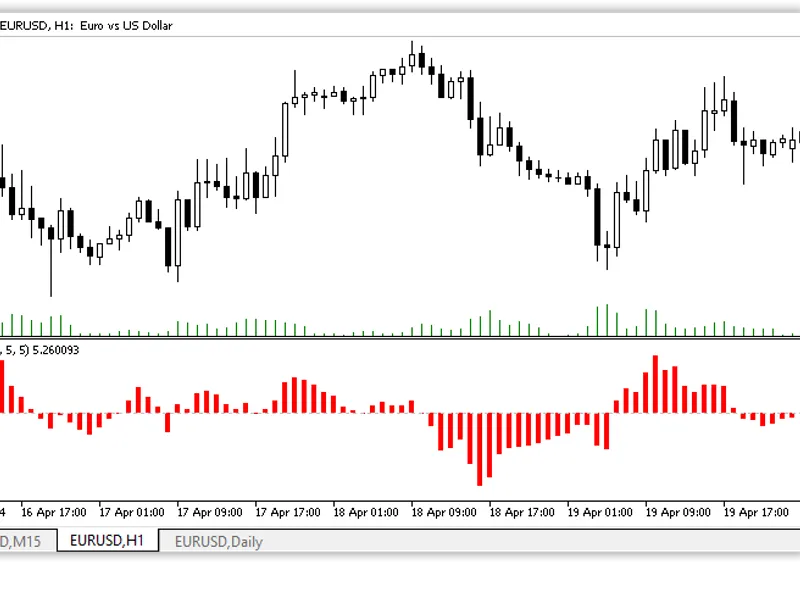
This indicator shows 3 big dots when the pattern is identified.
After that, on the next 3 candles, small dots will be shown identifying the theoretical entry point for a trade.
When the price reaches the theoretical entry point, a Buy/Sell arrow appears.
Hope this indicator is useful to the community!
Please feel free to post bugs, comments, and tips on what type of markets, stocks and timeframes this indicator performs well.
You may also like: Wcci Patterns - excellent alternative for indicator users on MetaTrader 5.
⚠ Limitations & Risk Warning
- This tool is provided for educational and testing purposes only.
- Past performance does not guarantee future results.
- Trading involves substantial risk of loss. Use on a demo account first.
- Results may vary depending on market conditions, broker, and settings.
- We recommend thorough backtesting and forward testing before using with real funds.