Nonparametric Zig Zag, A-la Clyde Lee Patterns
This professional-grade solution for MetaTrader 5 helps traders achieve greater efficiency in their daily workflow. This technical indicator acts as a specialized analysis tool designed to visualize market data. It helps traders identify emerging trends, momentum shifts, and key support or resistance levels by plotting statistical calculations directly onto price charts.
How to Setup and Use Nonparametric Zig Zag, A-la Clyde Lee Patterns
1. Installation: Place your file in the MQL/Indicators folder via "Open Data Folder" and restart your terminal.
2. Loading: Find the indicator in the Navigator, drag it onto your chart, and configure the input parameters in the popup window.
3. Customization: Press Ctrl+I to open the indicator list, select your tool, and click "Properties" to change colors, levels, or visual styles.
4. Updating: Replace the old file in the Indicators folder with the new version and restart the platform to apply changes.
Frequently Asked Questions
Q: Why is my indicator not showing? A: Verify the file is in the MQL/Indicators folder, or try right-clicking the "Indicators" tree in the Navigator and clicking "Refresh."
Q: Do custom indicators slow down the platform? A: Too many complex indicators can impact performance; remove unused ones via the "Indicator List" (Ctrl+I).
Q: Can I use MT4 indicators on MT5? A: No, MQL4 and MQL5 are distinct languages; ensure the indicator is compiled specifically for your platform version.
Description & Settings
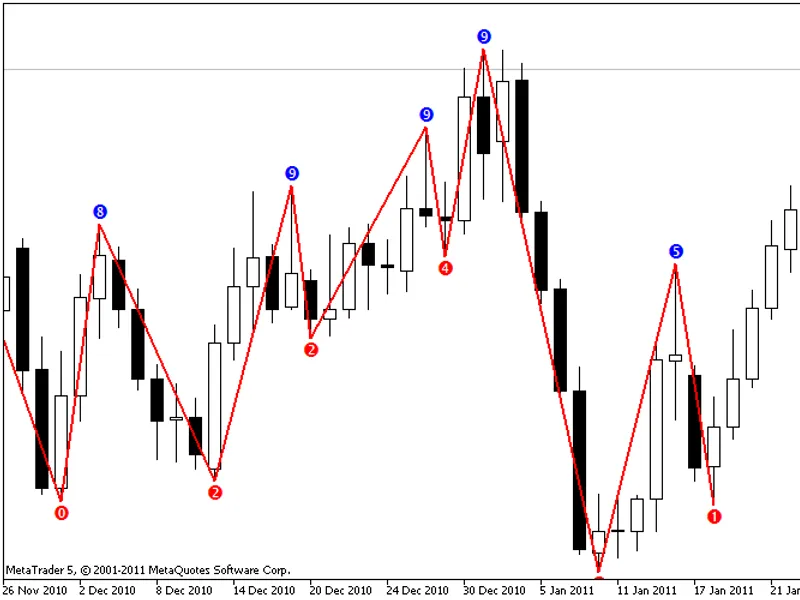
The upward ZigZag segment starts when bullish (rising) patterns for High and Low has appeaed on the current bar. The same is for the downward ZigZag segments. The ZigZag line (ZigZagLineBuffer) is plotted starting from the beginning of the segment up to begining of the opposite segment.
The number under the bar indicates the pattern index (P0..P4) of the "Low bars a-la Clyde Lee". The number above the bar (P5..P9) indicates the index of the a-la Clyde Lee High bars.
The indicator doesn't repaint.
I think that this ZigZag can be used to convert the chart into the segments for further analysis.