Extreme TM A line indicator
This is a powerful addition to your MetaTrader 5 toolkit designed to optimize market analysis and performance. This technical indicator acts as a specialized analysis tool designed to visualize market data. It helps traders identify emerging trends, momentum shifts, and key support or resistance levels by plotting statistical calculations directly onto price charts.
How to Setup and Use Extreme TM A line indicator
1. Installation: Place your file in the MQL/Indicators folder via "Open Data Folder" and restart your terminal.
2. Loading: Find the indicator in the Navigator, drag it onto your chart, and configure the input parameters in the popup window.
3. Customization: Press Ctrl+I to open the indicator list, select your tool, and click "Properties" to change colors, levels, or visual styles.
4. Updating: Replace the old file in the Indicators folder with the new version and restart the platform to apply changes.
Frequently Asked Questions
Q: Why is my indicator not showing? A: Verify the file is in the MQL/Indicators folder, or try right-clicking the "Indicators" tree in the Navigator and clicking "Refresh."
Q: Do custom indicators slow down the platform? A: Too many complex indicators can impact performance; remove unused ones via the "Indicator List" (Ctrl+I).
Q: Can I use MT4 indicators on MT5? A: No, MQL4 and MQL5 are distinct languages; ensure the indicator is compiled specifically for your platform version.
Description & Settings
Extreme TMA Line is a well-known channel indicator included into multiple Extreme TMA strategies.
There are five inputs:
TMA period
- TMA calculation period
ATR period
- ATR calculation period
ATR multiplier
- channel width ratio
Trend threshold
- trend type switch threshold
Redraw
- recalculation for compensating the indicator redrawing (Yes/No)
The indicator draws three lines: central (colored) and two channel ones. When detecting a bullish trend, the central line is colored green. When detecting a bearish one, the central line is colored red. The flat state is marked by gray color.
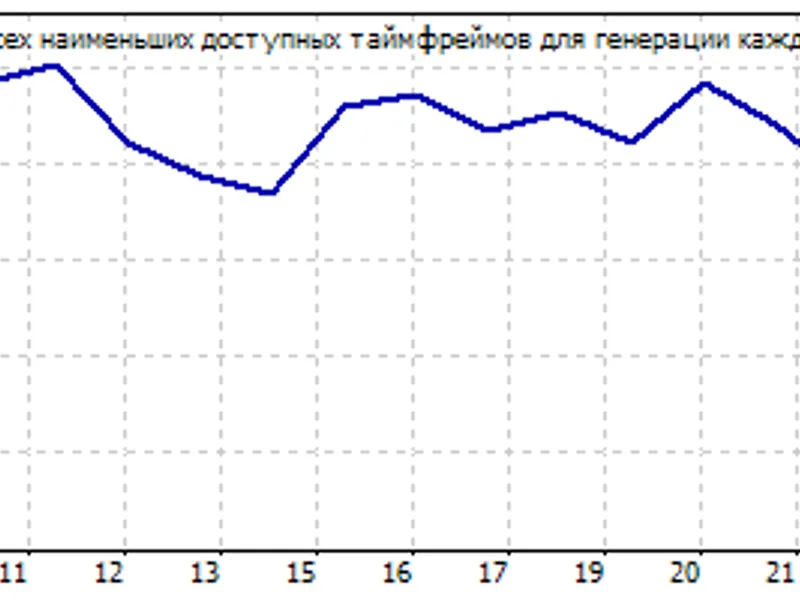
Fig. 1. Extreme TMA Line, Redraw = Yes
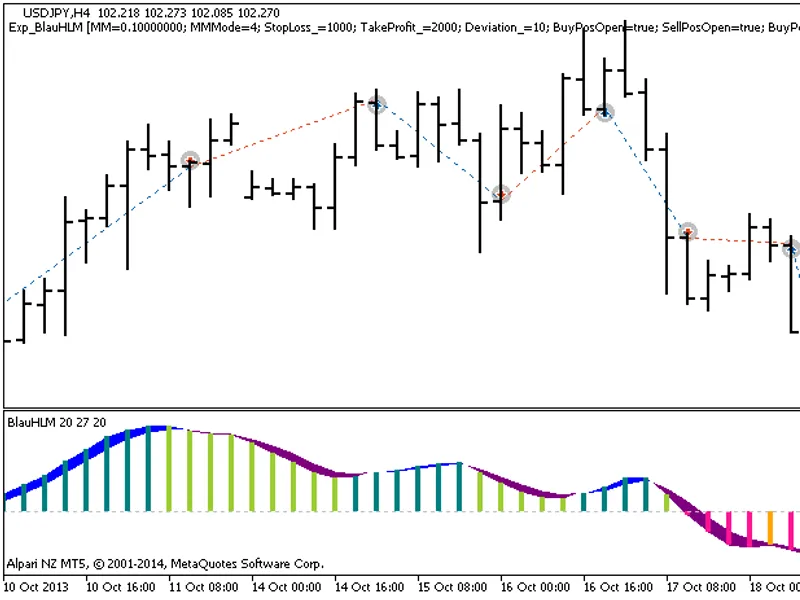
Fig. 2. Extreme TMA Line, Redraw = No