


Actual Resistance and Support Lines Indicator
Info
The Actual Resistance and Support Lines Indicator is a Indicator for MetaTrader 4 that this is a simple yet highly useful indicator. As is well-known, price is sensitive primarily to the nearest support and resistance lines.
Usage
This tool is typically used for enhancing chart analysis and decision making.
Platform
This Indicator works exclusively on MetaTrader 4 (both build 600+ and newer versions).
Setup
Place the downloaded file in MQL4/Indicators folder via File ? Open Data Folder in MetaTrader 4.
How to Install and Use Actual Resistance and Support Lines Indicator
1. Installation: Place your file in the MQL/Indicators folder via "Open Data Folder" and restart your terminal.
2. Loading: Find the indicator in the Navigator, drag it onto your chart, and configure the input parameters in the popup window.
3. Customization: Press Ctrl+I to open the indicator list, select your tool, and click "Properties" to change colors, levels, or visual styles.
4. Updating: Replace the old file in the Indicators folder with the new version and restart the platform to apply changes.
Frequently Asked Questions
Q: Why is my indicator not showing? A: Verify the file is in the MQL/Indicators folder, or try right-clicking the "Indicators" tree in the Navigator and clicking "Refresh."
Q: Do custom indicators slow down the platform? A: Too many complex indicators can impact performance; remove unused ones via the "Indicator List" (Ctrl+I).
Q: Can I use MT4 indicators on MT5? A: No, MQL4 and MQL5 are distinct languages; ensure the indicator is compiled specifically for your platform version.
What this tool does
This is a simple yet highly useful indicator.
Typical Use Case
This Indicator excels in automated trading and technical analysis on MetaTrader 4.
Compatible Platform & Setup
This Indicator works on MetaTrader 4. Place the file in the MQL4/Indicators folder and restart the terminal.
Description & Settings
Related: Fibonacci Support and Resistance Indicator - another powerful indicator for MetaTrader 4 traders.
This is a simple yet highly useful indicator.Also recommended: Automatic Parabolic Support and Resistance Levels Indicator - similar indicator with strong performance on MetaTrader 4.
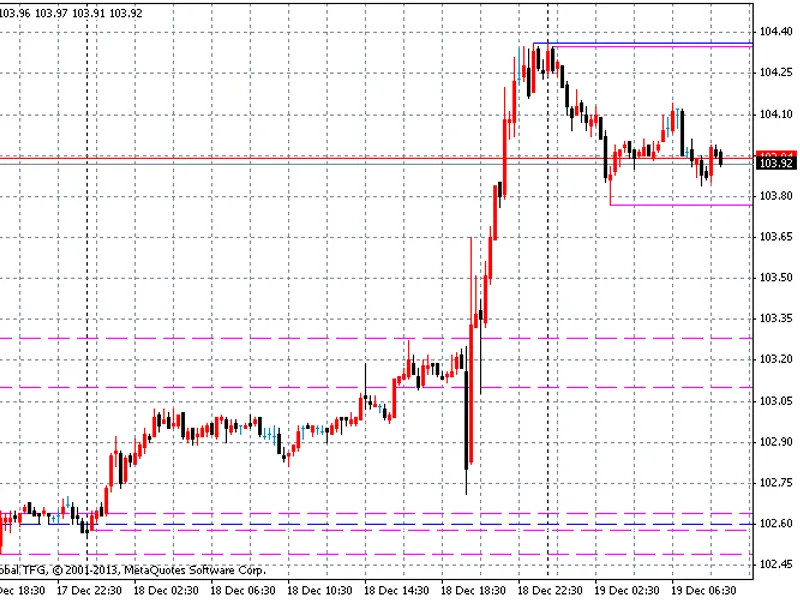
As is well-known, price is sensitive primarily to the nearest support and resistance lines.
These are essentially the maximum and minimum prices of recent days, weeks, and months.
This indicator displays exactly that.
Daily, weekly, and monthly lines are shown in different colors. Current lines are solid, while historical lines are dashed.
The external variables are intuitive:
Day_Hist = 3; - Number of days of history for displaying lines (setting to 0 will display only current support and resistance lines).
Week_Hist = 3; - Also for weeks.
Month_Hist = 3; - Also for months.
color_Day = Magenta;
color_Week = Green;
color_Month = Blue;
You may also like: MT Resistance and Support - excellent alternative for indicator users on MetaTrader 4.
⚠ Limitations & Risk Warning
- This tool is provided for educational and testing purposes only.
- Past performance does not guarantee future results.
- Trading involves substantial risk of loss. Use on a demo account first.
- Results may vary depending on market conditions, broker, and settings.
- We recommend thorough backtesting and forward testing before using with real funds.