
Bands Stoch RSI Extreme Reversal Signals
Info
The Bands Stoch RSI Extreme Reversal Signals is a Indicator for MetaTrader 5 that signals preview:features:detects mean-reversion signals when price closes back inside the bollinger band after a stochastic rsi extreme. Bear signal: prior bar closed above the upper band with %K and %D both above the upper limit, current bar closes back inside.
Usage
This tool is typically used for enhancing chart analysis and decision making.
Platform
This Indicator works exclusively on MetaTrader 5 (both build 600+ and newer versions).
Setup
Place the downloaded file in MQL5/Indicators folder via File ? Open Data Folder in MetaTrader 5.
How to Install and Use Bands Stoch RSI Extreme Reversal Signals
1. Installation: Place your file in the MQL/Indicators folder via "Open Data Folder" and restart your terminal.
2. Loading: Find the indicator in the Navigator, drag it onto your chart, and configure the input parameters in the popup window.
3. Customization: Press Ctrl+I to open the indicator list, select your tool, and click "Properties" to change colors, levels, or visual styles.
4. Updating: Replace the old file in the Indicators folder with the new version and restart the platform to apply changes.
Frequently Asked Questions
Q: Why is my indicator not showing? A: Verify the file is in the MQL/Indicators folder, or try right-clicking the "Indicators" tree in the Navigator and clicking "Refresh."
Q: Do custom indicators slow down the platform? A: Too many complex indicators can impact performance; remove unused ones via the "Indicator List" (Ctrl+I).
Q: Can I use MT4 indicators on MT5? A: No, MQL4 and MQL5 are distinct languages; ensure the indicator is compiled specifically for your platform version.
What this tool does
Signals Preview:Features:Detects mean-reversion signals when price closes back inside the Bollinger Band after a Stochastic RSI extreme.
Typical Use Case
This Indicator excels in automated trading and technical analysis on MetaTrader 5.
Compatible Platform & Setup
This Indicator works on MetaTrader 5. Place the file in the MQL5/Indicators folder and restart the terminal.
Description & Settings
Related: B Bands Psar Indicator - another powerful indicator for MetaTrader 5 traders.
Signals Preview:Features:
Detects mean-reversion signals when price closes back inside the Bollinger Band after a Stochastic RSI extreme.
Also recommended: stochastic multi-timeframe indicator - similar indicator with strong performance on MetaTrader 5.
Bear signal: prior bar closed above the upper band with %K and %D both above the upper limit, current bar closes back inside.
Bull signal: prior bar closed below the lower band with %K and %D both below the lower limit, current bar closes back inside.
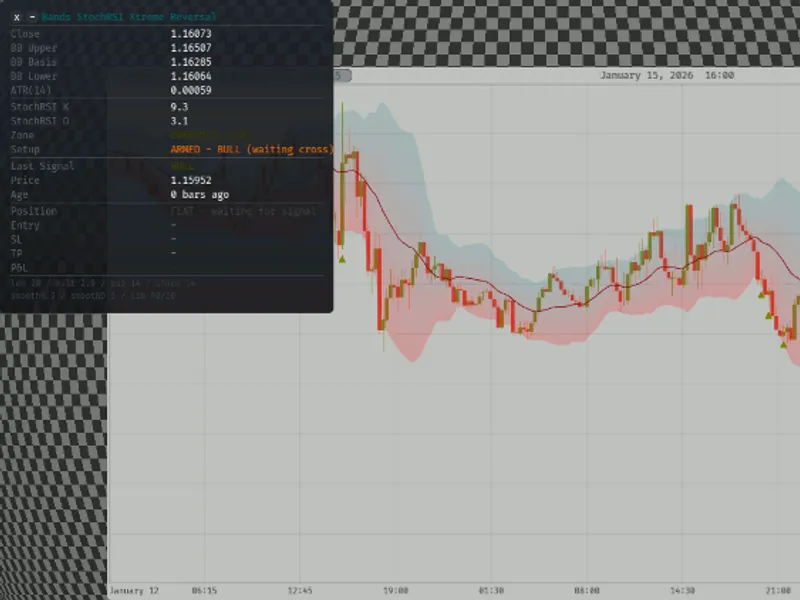
Bear/bull arrows plotted on the signal bar, offset from price by a fraction of ATR(14) so they don't overlap the candle.
Built-in Stochastic RSI (RSI passed through its own rolling stochastic + double SMA smoothing) - no external indicator required, everything is calculated inside this single file.
Bollinger Bands plotted as a shaded fill between the upper and lower bands, plus the basis (mid) line.
On-chart status panel showing live readings, current zone, armed setups, and the last signal fired.
Parameters:
Parameter Name
Description
InpLength
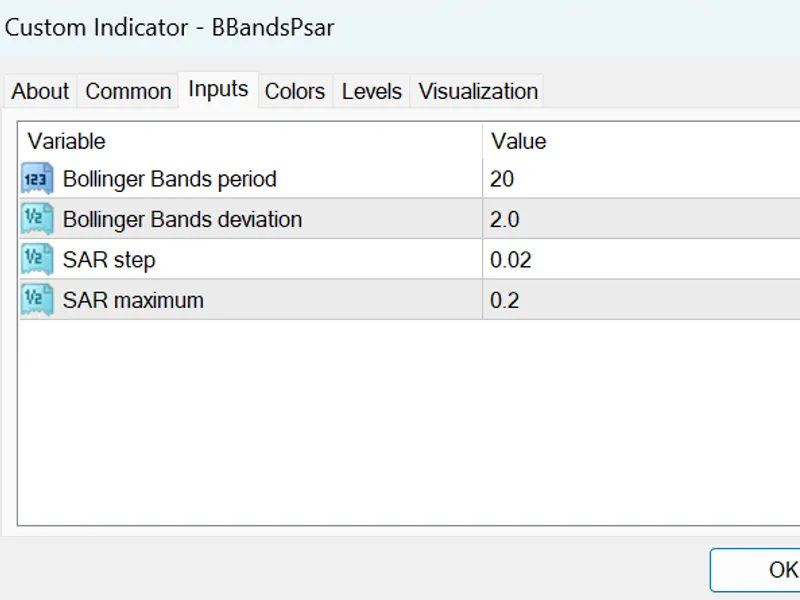
Bollinger Bands period.
InpMult
Bollinger Bands standard deviation multiplier.
InpLengthRSI
RSI period used as the Stochastic RSI's source.
InpLengthStoch
Lookback period for the rolling highest/lowest RSI (the "stochastic" part).
InpSmoothK
Smoothing period for %K.
InpSmoothD
Smoothing period for %D (signal line).
InpUpperLimit
Overbought threshold for %K/%D (default 90).
InpLowerLimit
Oversold threshold for %K/%D (default 10).
How to Use:
A simple step-by-step guide:
Attach the indicator to any chart/timeframe.
Adjust BB Period/Deviations and Stochastic RSI settings if you want a different sensitivity, or leave the defaults.
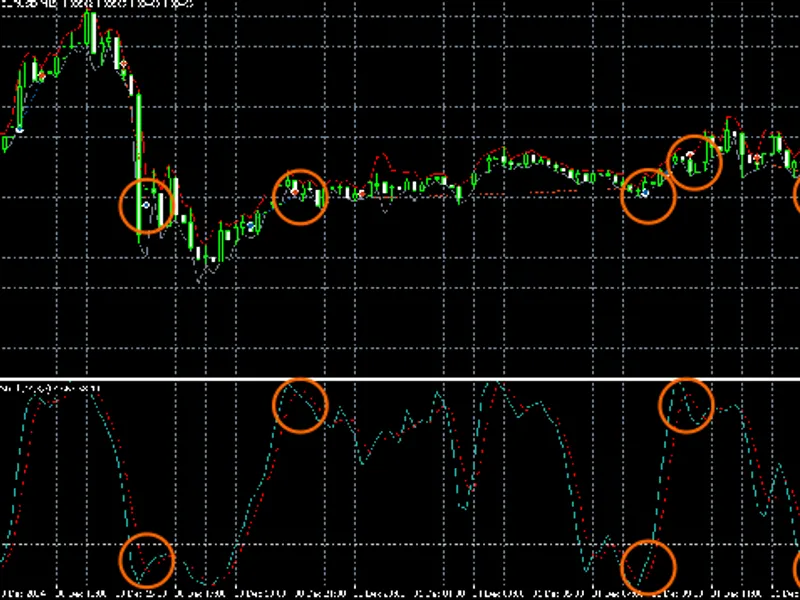
Watch for a triangle-down arrow above a candle - price closed above the upper band while StochRSI was overbought, then closed back inside: a bearish reversal signal.
Watch for a triangle-up arrow below a candle - price closed below the lower band while StochRSI was oversold, then closed back inside: a bullish reversal signal.
Use the on-chart panel to check the current zone, whether a setup is "armed" and waiting for the cross-back, and details of the last signal fired.
What's in the Panel?
Live Close, BB Upper/Basis/Lower, and ATR(14) readings for the current bar.
Current Stochastic RSI %K/%D values and the resulting Zone (Overbought / Oversold / Neutral).
Setup status - flags when the last closed bar met the extreme precondition and is "armed", waiting for the current bar to cross back inside the band.
Last Signal - type, price, and how many bars ago it fired.
Notes and Limitations:
Signal only:
This indicator does not place trades. It's for visual/analytical use - no order management, no SL/TP.
Single file:
Everything (Bollinger Bands, Stochastic RSI, signal logic, and panel) is self-contained in one .mq5 file - no external indicators or includes required.
Repaint-free:
Signals are evaluated on closed bars only; the signal bar itself does not repaint once formed.
Standard RSI:
The embedded RSI uses Wilder's smoothing (the standard method), calculated via iRSI(); only the stochastic-of-RSI stage is custom.
Screenshots:
Conclusion:
Whether you trade mean-reversion setups or just want a quick visual read on when price has stretched too far and is snapping back, this indicator combines Bollinger Bands and Stochastic RSI into one clean, self-contained signal with a live status panel. (Last updated 2026)
You may also like: stochastic oscillator indicator for metatrader 5 - excellent alternative for indicator users on MetaTrader 5.
Source Code
#property copyright "RobotFX"
#property link "https://robotfx.org"
#property version   "1.00"
#property indicator_chart_window
#property indicator_buffers 7
#property indicator_plots   6
#property indicator_label1  "Upper"
#property indicator_type1   DRAW_LINE
#property indicator_color1  C'0,128,128'
#property indicator_width1  1
.......
⚠ Limitations & Risk Warning
- This tool is provided for educational and testing purposes only.
- Past performance does not guarantee future results.
- Trading involves substantial risk of loss. Use on a demo account first.
- Results may vary depending on market conditions, broker, and settings.
- We recommend thorough backtesting and forward testing before using with real funds.