
Download ALL MT5 indicators (5730)

Similar MetaTrader Tools
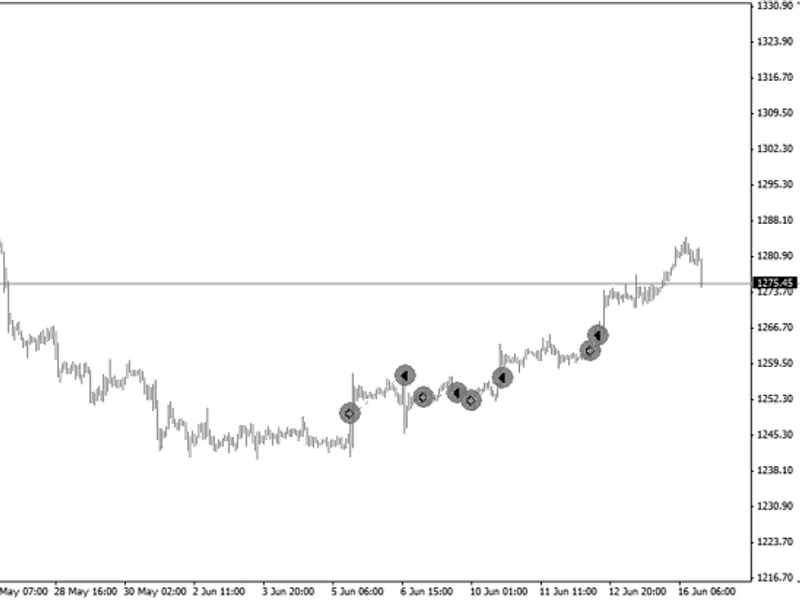
EVT Crash Gauge: Advanced Tail-Risk Measurement
Info
The EVT Crash Gauge: Advanced Tail-Risk Measurement is a Indicator for MetaTrader 5 that overviewmany standard metatrader 5 risk tools assume that the maximum potential loss is similar to the largest loss observed historically. Tools like Average True Range adjust position sizes based on recent volatility, Monte Carlo simulations reorder past trades, and Historical Value at Risk uses percentiles from your return history.
Usage
This tool is typically used for enhancing chart analysis and decision making.
Platform
This Indicator works exclusively on MetaTrader 5 (both build 600+ and newer versions).
Setup
Place the downloaded file in MQL5/Indicators folder via File ? Open Data Folder in MetaTrader 5.
How to Install and Use EVT Crash Gauge: Advanced Tail-Risk Measurement
1. Installation: Place your file in the MQL/Indicators folder via "Open Data Folder" and restart your terminal.
2. Loading: Find the indicator in the Navigator, drag it onto your chart, and configure the input parameters in the popup window.
3. Customization: Press Ctrl+I to open the indicator list, select your tool, and click "Properties" to change colors, levels, or visual styles.
4. Updating: Replace the old file in the Indicators folder with the new version and restart the platform to apply changes.
Frequently Asked Questions
Q: Why is my indicator not showing? A: Verify the file is in the MQL/Indicators folder, or try right-clicking the "Indicators" tree in the Navigator and clicking "Refresh."
Q: Do custom indicators slow down the platform? A: Too many complex indicators can impact performance; remove unused ones via the "Indicator List" (Ctrl+I).
Q: Can I use MT4 indicators on MT5? A: No, MQL4 and MQL5 are distinct languages; ensure the indicator is compiled specifically for your platform version.
What this tool does
OverviewMany standard MetaTrader 5 risk tools assume that the maximum potential loss is similar to the largest loss observed historically.
Typical Use Case
This Indicator excels in automated trading and technical analysis on MetaTrader 5.
Compatible Platform & Setup
This Indicator works on MetaTrader 5. Place the file in the MQL5/Indicators folder and restart the terminal.
Description & Settings
Related: crash spike trade pattern - another powerful indicator for MetaTrader 5 traders.
OverviewMany standard MetaTrader 5 risk tools assume that the maximum potential loss is similar to the largest loss observed historically. Tools like Average True Range adjust position sizes based on recent volatility, Monte Carlo simulations reorder past trades, and Historical Value at Risk uses percentiles from your return history. These methods focus on the main body of the distribution and assume future market movements will not exceed past extremes.
Also recommended: projection bands - similar indicator with strong performance on MetaTrader 5.
However, financial returns exhibit fat tails, meaning extreme events occur more frequently and are larger than predicted by a normal distribution. Relying solely on past losses will systematically underestimate the potential impact of rare crashes.
The normal distribution model (curve) compared to fat-tailed financial returns (histogram). The shaded left tail represents the uncaptured risk.
This indicator introduces Extreme Value Theory (EVT), a branch of statistics designed to model these tail events, directly into MQL5. EVT focuses specifically on the tail of the distribution, using a theoretical shape justified by limit theorems rather than assumptions. This fitted model can then extrapolate potential losses far beyond historical data, estimating events like a 99.9% loss or a once-in-three-years market move, even if such an event has never occurred in your recorded history.
The Method: Peaks-Over-Threshold
The indicator employs the Peaks-Over-Threshold (POT) method. It converts chart closing prices into a series of one-sided downside losses, recording the magnitude of each loss and setting gains to zero. A high threshold (u) is selected based on a quantile of this loss series. Losses below this threshold are discarded, and only the *exceedances* (the amounts by which losses surpass the threshold) are analyzed. The Pickands-Balkema-de Haan theorem states that for many underlying distributions, these excesses converge towards a Generalized Pareto Distribution (GPD) as the threshold increases. This means the shape of the tail does not need to be guessed; it can be fitted to the data.
Peaks-Over-Threshold illustration: a threshold is set on the loss series, exceedances above it are captured, and a Generalized Pareto Distribution is fitted to these excesses.
The fitting process uses maximum-likelihood optimization of the GPD's shape and scale parameters. This is performed using the ALGLIB constrained optimizer included with the terminal, eliminating the need for external libraries, Python bridges, or DLLs.
Scope of Application
EVT is a tool for measuring risk *magnitude*, not for market *timing*. It quantizes the potential severity of rare losses and indicates whether the tail risk is increasing or decreasing. It does not predict the timing of crashes or suggest trading directions. Interpreting a rising tail shape as a
You may also like: vgrid line custom - excellent alternative for indicator users on MetaTrader 5.
Source Code
#property copyright "RobotFX"
#property link "https://robotfx.org"
#property version   "1.00"
#property strict
#property indicator_separate_window
#property indicator_buffers 1
#property indicator_plots   1
#property indicator_label1  "EVT VaR"
#property indicator_type1   DRAW_LINE
#property indicator_color1  clrOrangeRed
.......
⚠ Limitations & Risk Warning
- This tool is provided for educational and testing purposes only.
- Past performance does not guarantee future results.
- Trading involves substantial risk of loss. Use on a demo account first.
- Results may vary depending on market conditions, broker, and settings.
- We recommend thorough backtesting and forward testing before using with real funds.