Projection Bands
This is a powerful addition to your MetaTrader 5 toolkit designed to optimize market analysis and performance. This technical indicator acts as a specialized analysis tool designed to visualize market data. It helps traders identify emerging trends, momentum shifts, and key support or resistance levels by plotting statistical calculations directly onto price charts.
How to Setup and Use Projection Bands
1. Installation: Place your file in the MQL/Indicators folder via "Open Data Folder" and restart your terminal.
2. Loading: Find the indicator in the Navigator, drag it onto your chart, and configure the input parameters in the popup window.
3. Customization: Press Ctrl+I to open the indicator list, select your tool, and click "Properties" to change colors, levels, or visual styles.
4. Updating: Replace the old file in the Indicators folder with the new version and restart the platform to apply changes.
Frequently Asked Questions
Q: Why is my indicator not showing? A: Verify the file is in the MQL/Indicators folder, or try right-clicking the "Indicators" tree in the Navigator and clicking "Refresh."
Q: Do custom indicators slow down the platform? A: Too many complex indicators can impact performance; remove unused ones via the "Indicator List" (Ctrl+I).
Q: Can I use MT4 indicators on MT5? A: No, MQL4 and MQL5 are distinct languages; ensure the indicator is compiled specifically for your platform version.
Description & Settings
The indicator was first proposed by Mel Widner ("Technical Analysis of Stocks & Commodities" magazine, July 1995). Along with similar indicators, such as price channels, envelopes or Bollinger bands, it allows you to define the borders of price ranges.
The indicator has one customizable parameter:
Period
- calculation period.
Calculation:
where:
SlopeHigh - regression line slope of High prices in the Period range;
SlopeLow - regression line slope of Low prices in the Period range.
Interpretation:
When the price reaches the upper border, it is considered to be at the resistance level. The market is overbought;
When the price is located on the lower border, the market is oversold.
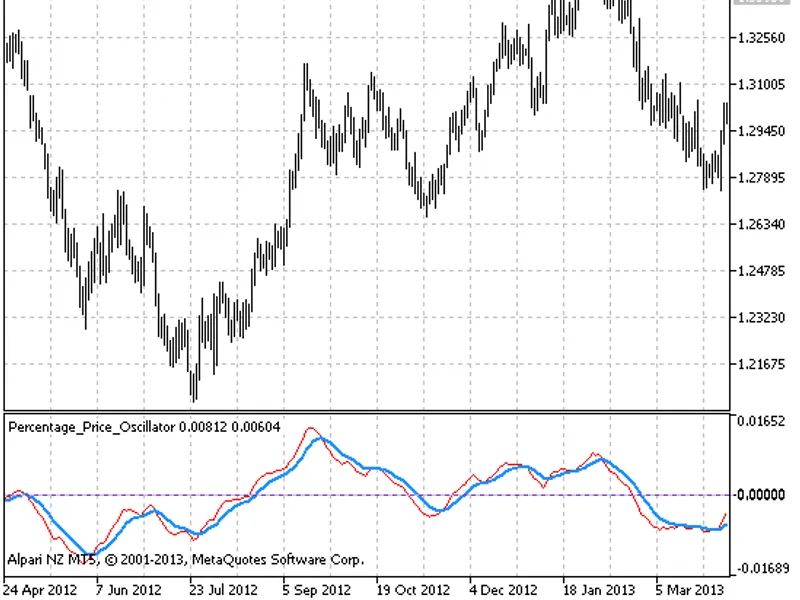
In order to sort out signals, use a a detrending oscillator to exclude the trend component, since overbought/oversold levels may be constantly updated by new prices during strong trends, which leads to false signals and losses.