RS I Bollinger Bands EA
This is a powerful addition to your MetaTrader 4 toolkit designed to optimize market analysis and performance. This Expert Advisor serves as automated trading software. It is utilized to monitor financial markets and execute trades based on predefined algorithmic rules, enabling precise position management without the need for constant manual oversight.
How to Setup and Use RS I Bollinger Bands EA
1. Installation: Open the "File" menu, select "Open Data Folder," navigate to MQL/Experts, paste your file, and restart the terminal.
2. Activation: Drag the EA from the Navigator onto a chart, ensure "Allow live trading" is checked in the Common tab, and verify the AutoTrading button is green.
3. Optimization: Right-click your chart, choose "Expert List," click "Properties" to adjust inputs, and save your preferred setup as a set file for future use.
4. Maintenance: Regularly check the "Experts" tab in the terminal window to monitor trade logs and potential execution errors.
Frequently Asked Questions
Q: Why is my EA not opening trades? A: Check the "AutoTrading" button, ensure "Allow live trading" is enabled, and verify your broker allows automated trading on your account type.
Q: Can I run multiple EAs on one chart? A: No, each chart can only host one active EA; however, you can open multiple charts for different currency pairs to run several EAs.
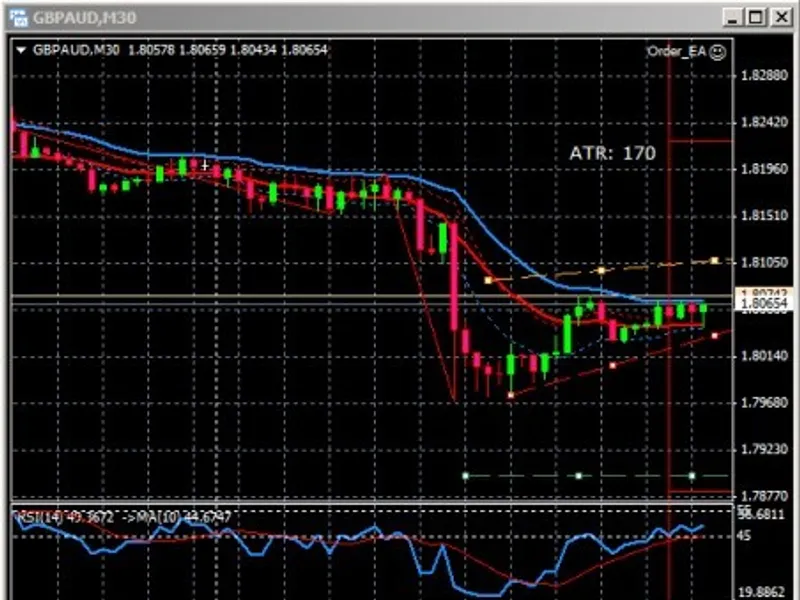
Q: What does the "smiley face" icon mean? A: A smiley face in the top-right corner of the chart indicates the EA is successfully running; a frowny face means it is disabled.
Description & Settings
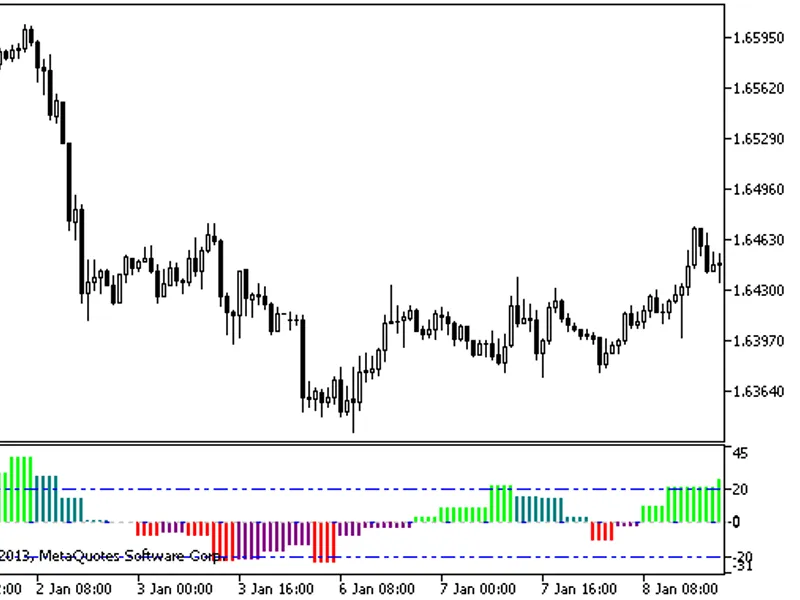
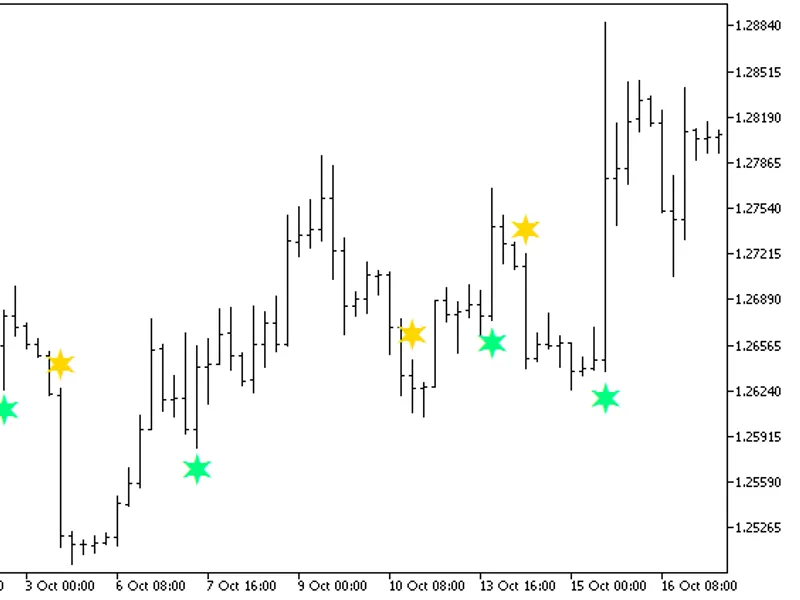
This program uses overbought (OB) and oversold (OS) regions in RSI space to generate short and long trading signals. OB and OS zones are established for the M15, H1 and H4 time frames. The EURUSD M15 chart is used for the program execution. The program contains two triggers to show a comparison of alternative OB/OS methods. Trigger 1 is a conventional method which utilizes fixed numbers for setting the overbought and oversold RSI regions. OB and OS regions are typically RSI values of 70 and 30.
Trigger 2 establishes RSI Bollinger Bands around an average RSI for a specific time duration. OB and OS regions are represented as the value of the standard deviations from the average RSI. For example, an overbought signal would be an RSI value above RSI_Upper where RSI_Upper = RSI_Sigma*StdDev + RSI_Avg. RSI_Sigma is an external value and StdDev is computed from the RSI distribution for past bars.
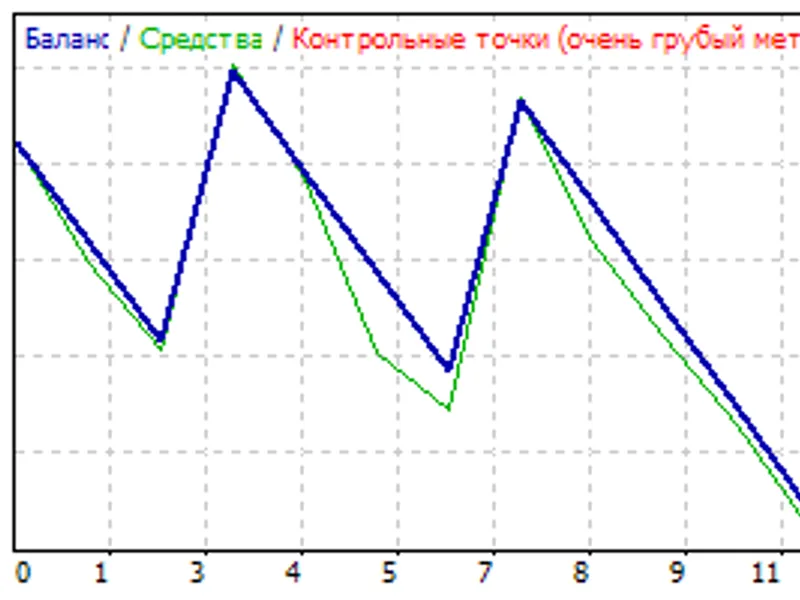
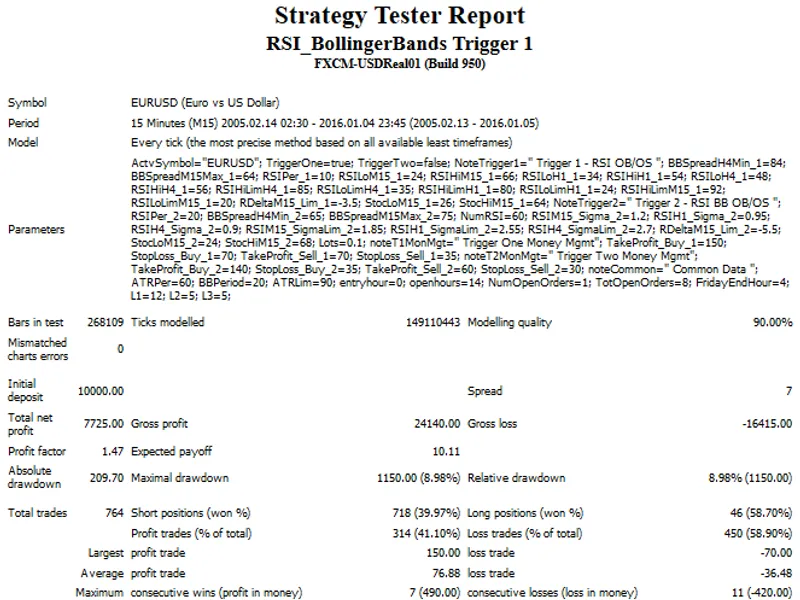
As seen from the two Strategy Tester reports, the RSI Bollinger Band method, Trigger 2, performs well over an eleven year period and also outperforms Trigger 1. In addition, Trigger 2 has fewer externals than Trigger 1 and has a more uniform performance over eleven years of 15 minute data.
Tester Reports
Date Test Range: 2/2005 - 1/2016 for Triggers 1 and 2.
Conclusions:
Applying the Bollinger Band method to oscillator type indicators may improve performance of Expert Advisors over long periods of test, giving more confidence to future performance.