Crash Spike Trade Pattern
This professional-grade solution for MetaTrader 5 helps traders achieve greater efficiency in their daily workflow. This technical indicator acts as a specialized analysis tool designed to visualize market data. It helps traders identify emerging trends, momentum shifts, and key support or resistance levels by plotting statistical calculations directly onto price charts.
How to Setup and Use Crash Spike Trade Pattern
1. Installation: Place your file in the MQL/Indicators folder via "Open Data Folder" and restart your terminal.
2. Loading: Find the indicator in the Navigator, drag it onto your chart, and configure the input parameters in the popup window.
3. Customization: Press Ctrl+I to open the indicator list, select your tool, and click "Properties" to change colors, levels, or visual styles.
4. Updating: Replace the old file in the Indicators folder with the new version and restart the platform to apply changes.
Frequently Asked Questions
Q: Why is my indicator not showing? A: Verify the file is in the MQL/Indicators folder, or try right-clicking the "Indicators" tree in the Navigator and clicking "Refresh."
Q: Do custom indicators slow down the platform? A: Too many complex indicators can impact performance; remove unused ones via the "Indicator List" (Ctrl+I).
Q: Can I use MT4 indicators on MT5? A: No, MQL4 and MQL5 are distinct languages; ensure the indicator is compiled specifically for your platform version.
Description & Settings
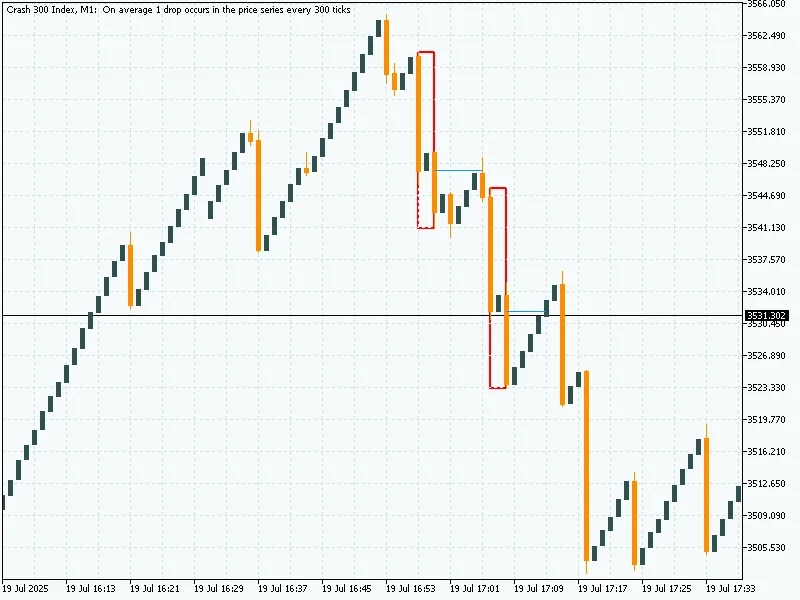
This MT5 indicator detects
Crash market spike patterns
using a specific
3-candle formation
:
Red-Green-Red
candle pattern (where red candles are strong spikes and the green is a middle retracement).
When the pattern is found, it
draws a box
around the high/low of those 3 candles.
It also plots a
horizontal entry line
at the
middle candle’s open price
.
The line stays active until price returns to that level (mitigation).
Once the
entry price is hit (mitigated)
, the entry line is replaced by a
shorter fixed line
from the pattern to the mitigation candle.
It works on both
historical and real-time candles
.
Visually helps identify potential
return-to-zone trading opportunities
.
This indicator detects a
specific bearish spike formation
over 3 candles:
Candle 1
:
Bearish (Red candle).
Long wick.
Body must be
greater than 70%
of the total candle range (i.e., a strong spike).
Candle 2 (Middle)
:
Bullish (Green candle).
Can be any size; just needs to be positive.
Candle 3
:
Bearish again.
Same condition as Candle 1: body > 70% of full range.
When this pattern is found:
It identifies a
"supply zone"
created by aggressive selling.
A
box
is drawn around the high and low of the 3 candles.
An
entry line
is drawn at the
open price of the middle (green) candle
, expecting price to return.
Core Idea / Strategy Concept
This tool is based on the
Smart Money Concept (SMC)
— particularly the idea of
mitigation zones
and
supply/demand imbalances
.
After a
strong bearish impulse
, price often retraces back to the
origin of the move
(the middle candle).
The indicator marks that area visually as a
“mitigation zone”
.
Once price
returns to this zone
(entry line), it is considered
"mitigated"
, and a trader may look for re-entry or reaction.
It
removes the entry line
after mitigation to keep the chart clean and optionally draws a
shorter line to show mitigation
.
Practical Use:
Look for
return-to-box
trades.
Works great in
confluence with other indicators
(like EMA, OBV, or order block confirmations).