DER O S C
This professional-grade solution for MetaTrader 5 helps traders achieve greater efficiency in their daily workflow. This technical indicator acts as a specialized analysis tool designed to visualize market data. It helps traders identify emerging trends, momentum shifts, and key support or resistance levels by plotting statistical calculations directly onto price charts.
How to Setup and Use DER O S C
1. Installation: Place your file in the MQL/Indicators folder via "Open Data Folder" and restart your terminal.
2. Loading: Find the indicator in the Navigator, drag it onto your chart, and configure the input parameters in the popup window.
3. Customization: Press Ctrl+I to open the indicator list, select your tool, and click "Properties" to change colors, levels, or visual styles.
4. Updating: Replace the old file in the Indicators folder with the new version and restart the platform to apply changes.
Frequently Asked Questions
Q: Why is my indicator not showing? A: Verify the file is in the MQL/Indicators folder, or try right-clicking the "Indicators" tree in the Navigator and clicking "Refresh."
Q: Do custom indicators slow down the platform? A: Too many complex indicators can impact performance; remove unused ones via the "Indicator List" (Ctrl+I).
Q: Can I use MT4 indicators on MT5? A: No, MQL4 and MQL5 are distinct languages; ensure the indicator is compiled specifically for your platform version.
Description & Settings
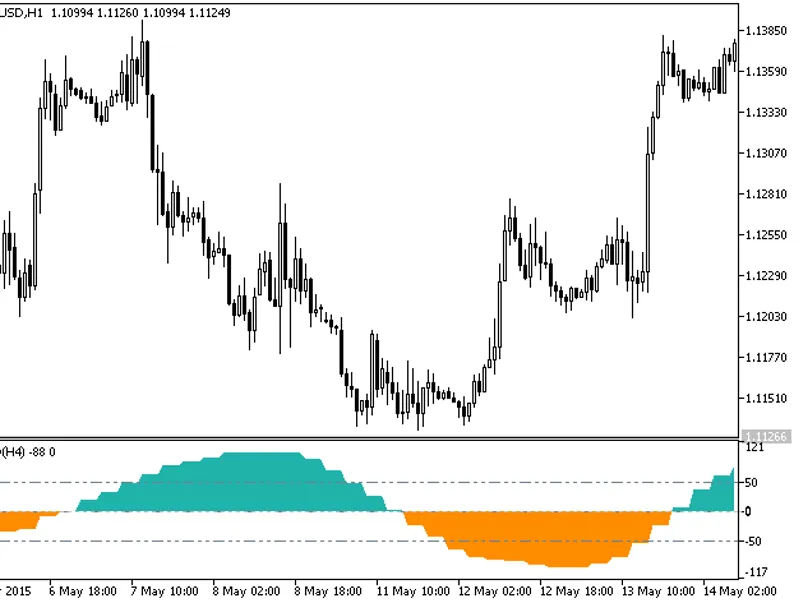
The Derivative Oscillator indicator by Constance Brown was published in her book "Technical Analysis for the Trading Professional"
The indicator is a twice exponentially smoothed RSI with the default parameters of 5 and 3.Then a signal line is formed by simple smoothing of the resulting 2ERSI with the period of 9.The derived histogram is calculated as a difference between 2ERSI and the signal line
There are five inputs:
RSI period
- period of RSI
First EMA period
- the period of the first smoothing EMA
Second EMA period
- the period of the second smoothing EMA
SMA period
- signal line smoothing period
Applied price
price used for calculations
Calculation:
where: