Day Extremum Zones
This tool for MetaTrader 5 is specifically engineered to streamline your trading operations. This technical indicator acts as a specialized analysis tool designed to visualize market data. It helps traders identify emerging trends, momentum shifts, and key support or resistance levels by plotting statistical calculations directly onto price charts.
How to Setup and Use Day Extremum Zones
1. Installation: Place your file in the MQL/Indicators folder via "Open Data Folder" and restart your terminal.
2. Loading: Find the indicator in the Navigator, drag it onto your chart, and configure the input parameters in the popup window.
3. Customization: Press Ctrl+I to open the indicator list, select your tool, and click "Properties" to change colors, levels, or visual styles.
4. Updating: Replace the old file in the Indicators folder with the new version and restart the platform to apply changes.
Frequently Asked Questions
Q: Why is my indicator not showing? A: Verify the file is in the MQL/Indicators folder, or try right-clicking the "Indicators" tree in the Navigator and clicking "Refresh."
Q: Do custom indicators slow down the platform? A: Too many complex indicators can impact performance; remove unused ones via the "Indicator List" (Ctrl+I).
Q: Can I use MT4 indicators on MT5? A: No, MQL4 and MQL5 are distinct languages; ensure the indicator is compiled specifically for your platform version.
Description & Settings
The indicator shows daily extremum zones. Maximum zone: distance from day maximum - Х% of day range, minimum zone: distance from day minimum + Y% of day range.
Flexible parameter setting is allowed. Tune zone parameters as you like!
The indicator can display information using one of five drawing styles:
Filling (DRAW_FILLING);
Histogram (DRAW_HISTOGRAM2);
Line (DRAW_LINE);
Arrows (DRAW_ARROW);
Not drawn (DRAW_NONE).
Usage:
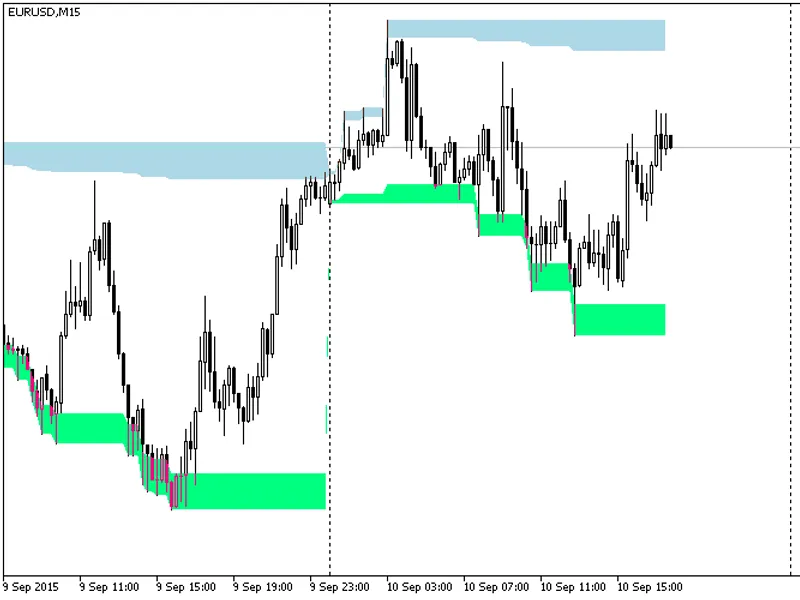
For Color fill and Histogram styles (zone size for maximums (inpUpZonePct) and zone size for minimums (inpDnZonePct) are not equal to 0), the indicator shows zones which can be treated as support zones.
Color fill drawing style. Using as support zones. Ranges = 10%
For Line and Arrows styles, the indicator can display both external and internal boundaries of relevant zones (by changing the inpDrawInternalZone parameter). When displaying the internal zone (its boundary is specified in settings, no more than 50% of day range from each side), you can set its value, for example, on a certain Fibonacci level. Using as a support level.
The green line is 38% from minimum (inpDnZonePct = 38), the blue line is 50% from day maximum (inpUpZonePct = 50). inpDrawInternalZone = true. Imitating Fibonacci levels
In all drawing styles, zones can be used as a filter for placing orders (avoid opening positions in ranges close to day maximum/minimum).
You can use it as a supplemental indicator in your own solutions, and it will not obstruct the screen. In this case, use Not drawn style.
Recommendations:
Pay attention to log records! Handling of common errors is implemented in the code.
Notes:
The indicator is displayed on timeframes up to Н2.
indicator is used for calculation.
The indicator shows values only on closed bars.
You can disable displaying values in the Data Window (set inpShowData = false).