Advance Trend Pressure
This tool for MetaTrader 5 is specifically engineered to streamline your trading operations. This technical indicator acts as a specialized analysis tool designed to visualize market data. It helps traders identify emerging trends, momentum shifts, and key support or resistance levels by plotting statistical calculations directly onto price charts.
How to Setup and Use Advance Trend Pressure
1. Installation: Place your file in the MQL/Indicators folder via "Open Data Folder" and restart your terminal.
2. Loading: Find the indicator in the Navigator, drag it onto your chart, and configure the input parameters in the popup window.
3. Customization: Press Ctrl+I to open the indicator list, select your tool, and click "Properties" to change colors, levels, or visual styles.
4. Updating: Replace the old file in the Indicators folder with the new version and restart the platform to apply changes.
Frequently Asked Questions
Q: Why is my indicator not showing? A: Verify the file is in the MQL/Indicators folder, or try right-clicking the "Indicators" tree in the Navigator and clicking "Refresh."
Q: Do custom indicators slow down the platform? A: Too many complex indicators can impact performance; remove unused ones via the "Indicator List" (Ctrl+I).
Q: Can I use MT4 indicators on MT5? A: No, MQL4 and MQL5 are distinct languages; ensure the indicator is compiled specifically for your platform version.
Description & Settings
The Advance Trend Pressure indicator shows the trend direction and strength line. It can additionally show the bullish and bearish components of the trend.
Trend is determined using Close-Open, High-Close and Open-Close price (for a bearish candlestick) and Open-Close, High-Open and Close-Low prices (for a bearish candlestick) - i.e. the indicator uses the size and direction of candlestick bodies and the size of their shadows.
It has two parameters:
Period
- indicator calculation period;
Show lines Up and Down
- showing the lines of the bullish and bearish components.
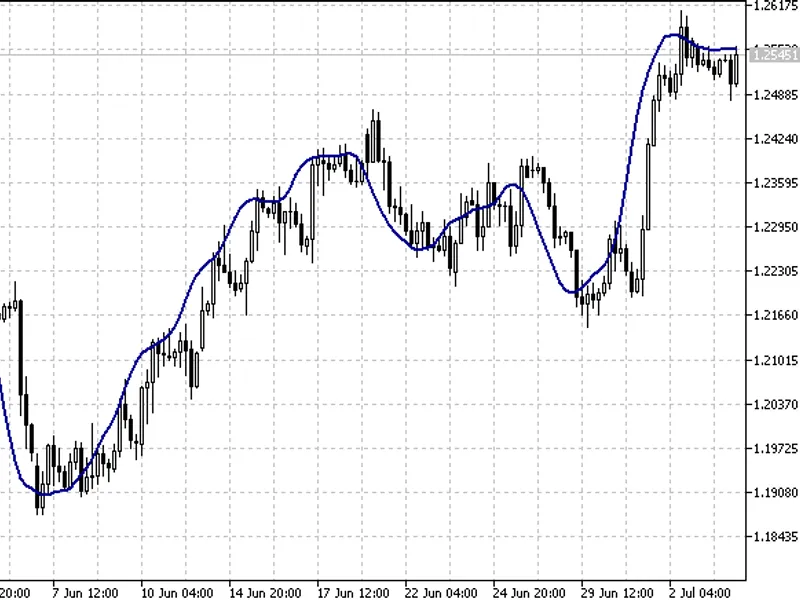
Fig.1 Trend direction and strength line.
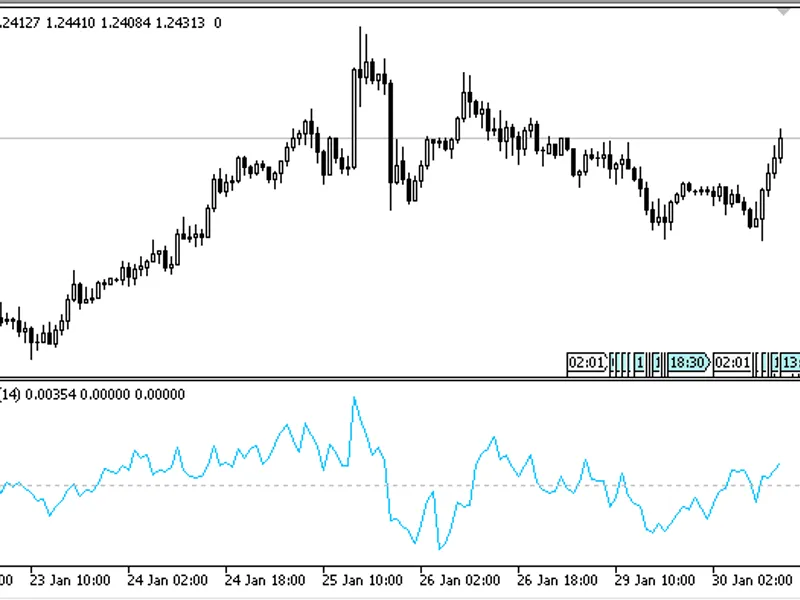
Fig.2 Trend direction and strength line with the lines of bullish and bearish components.