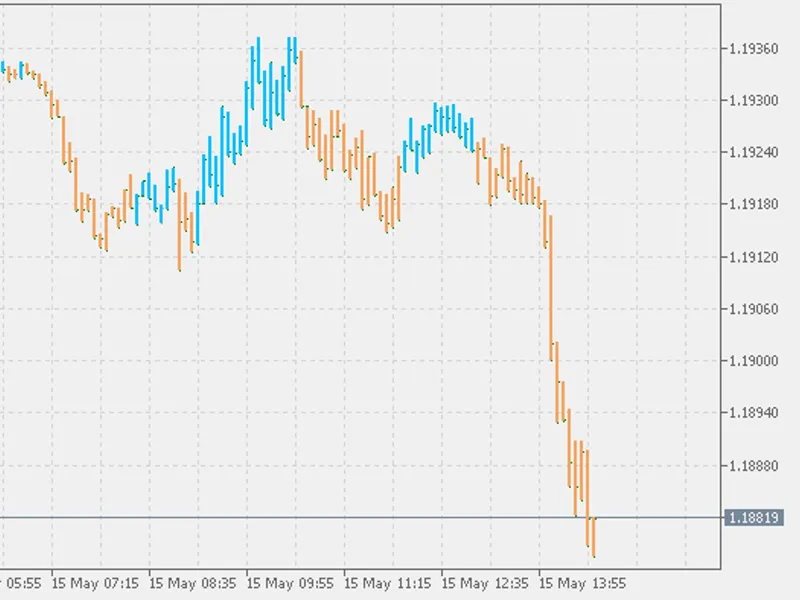
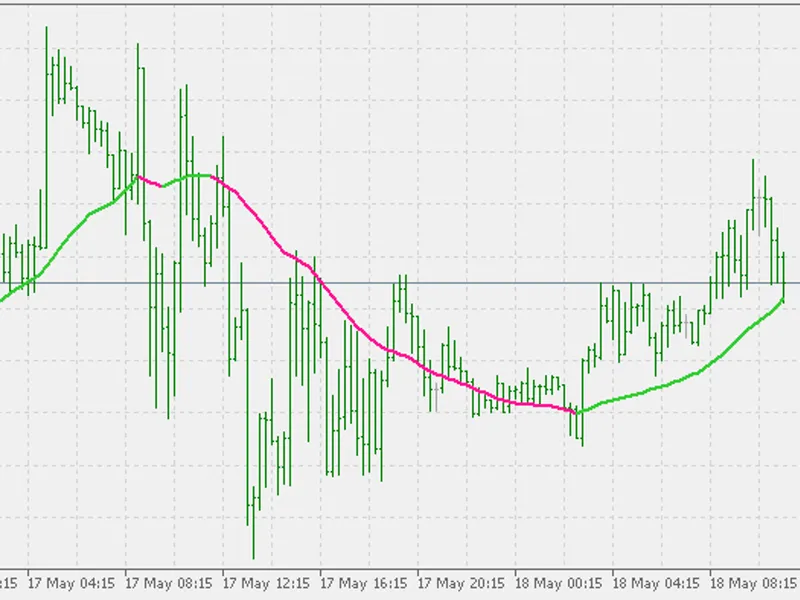
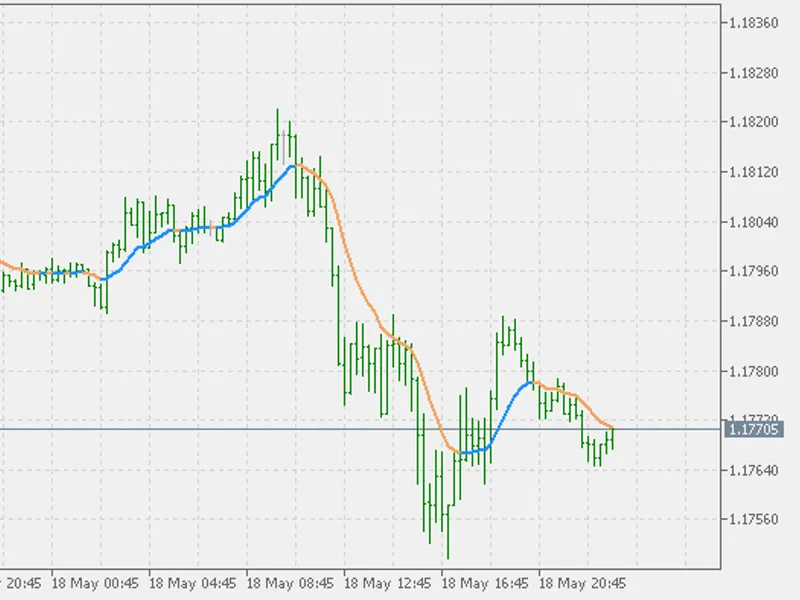
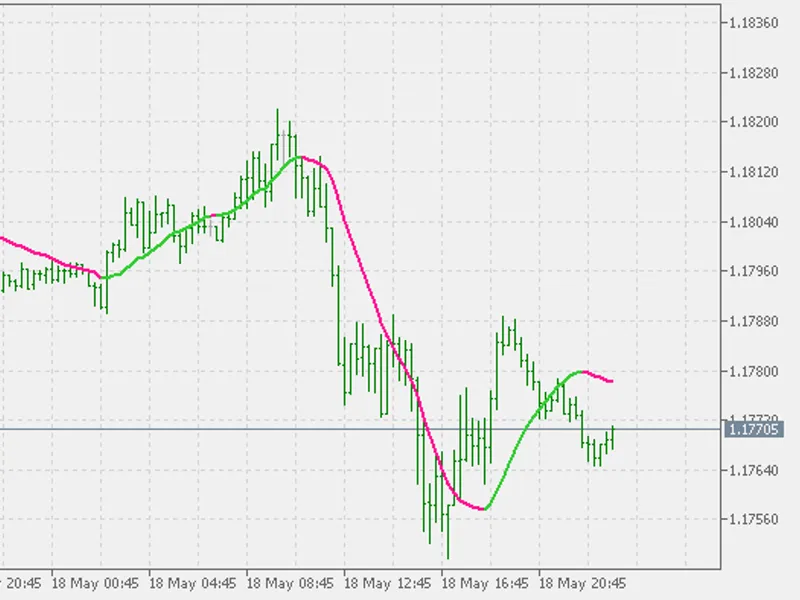
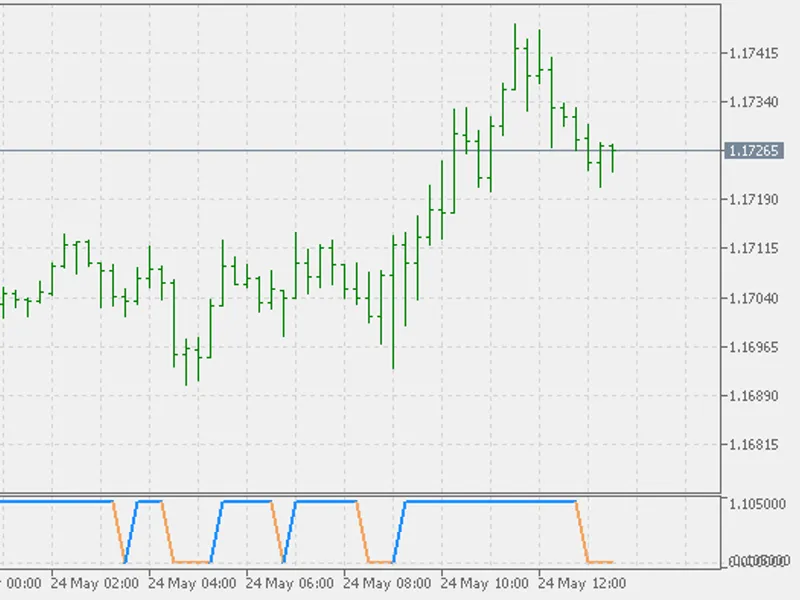
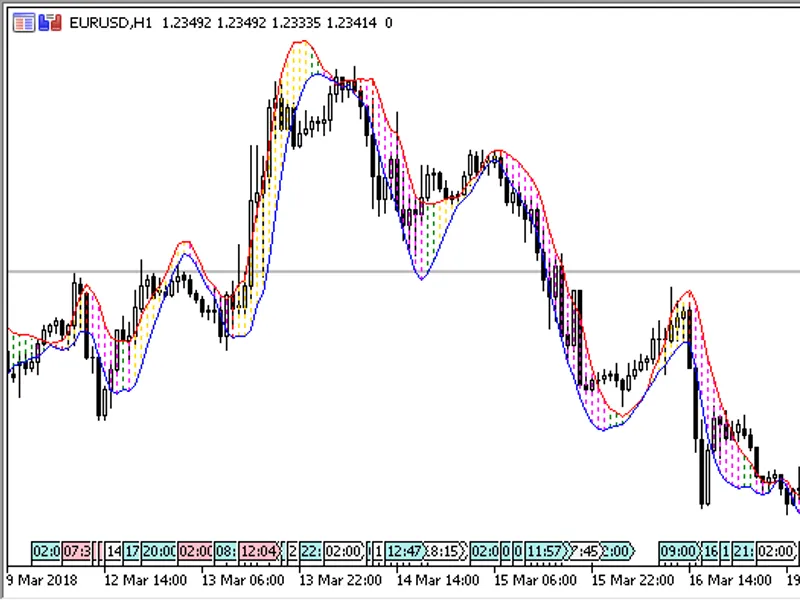
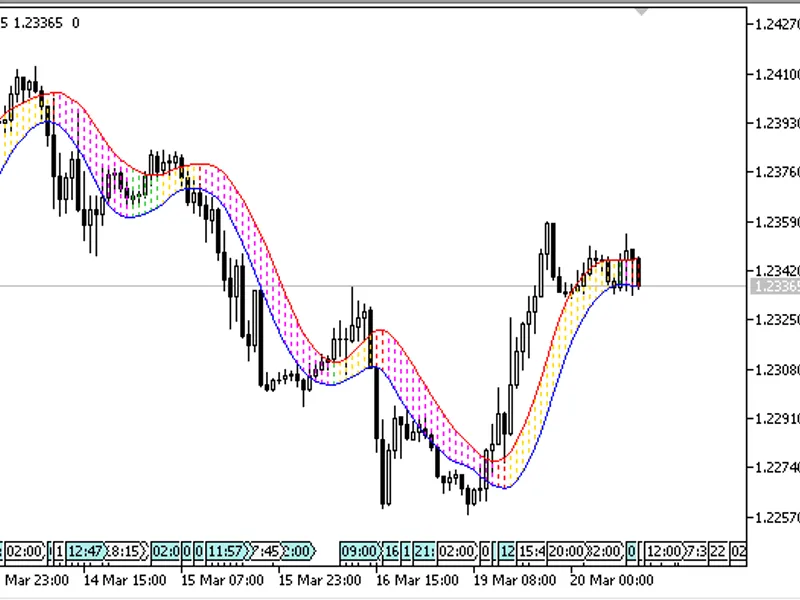
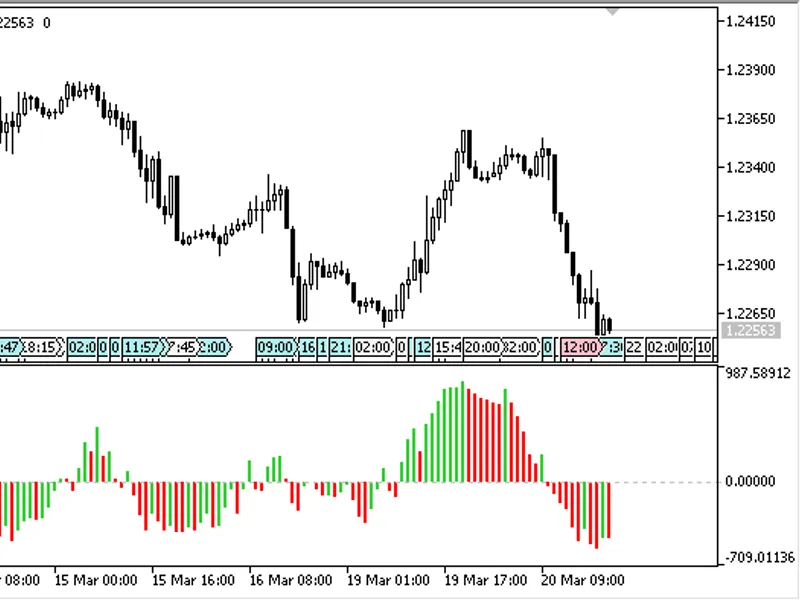
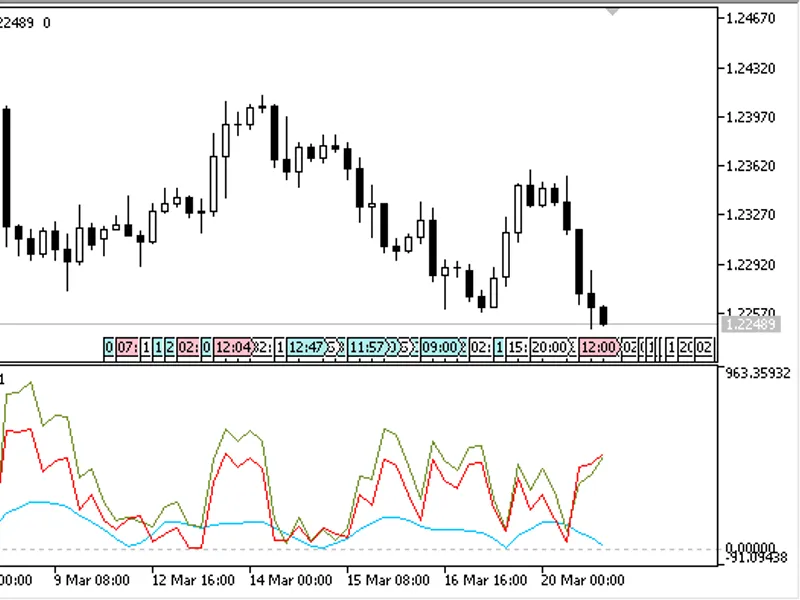
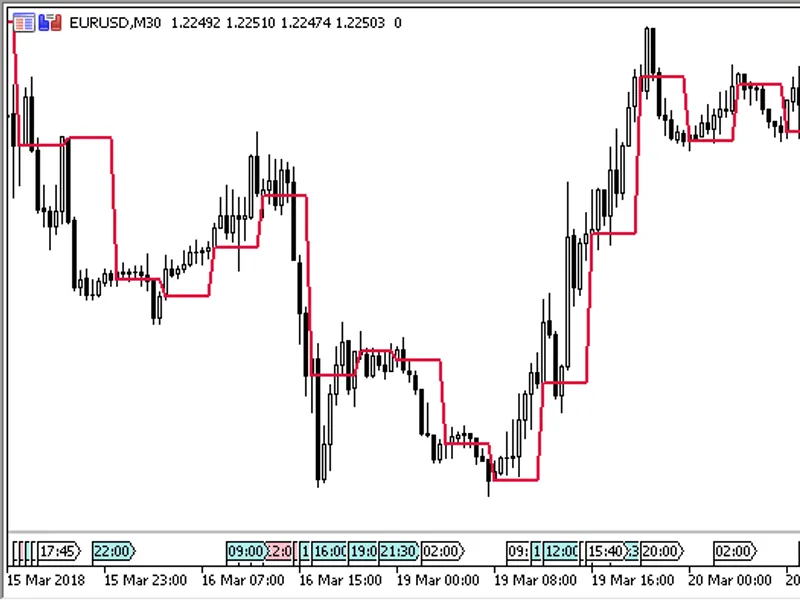
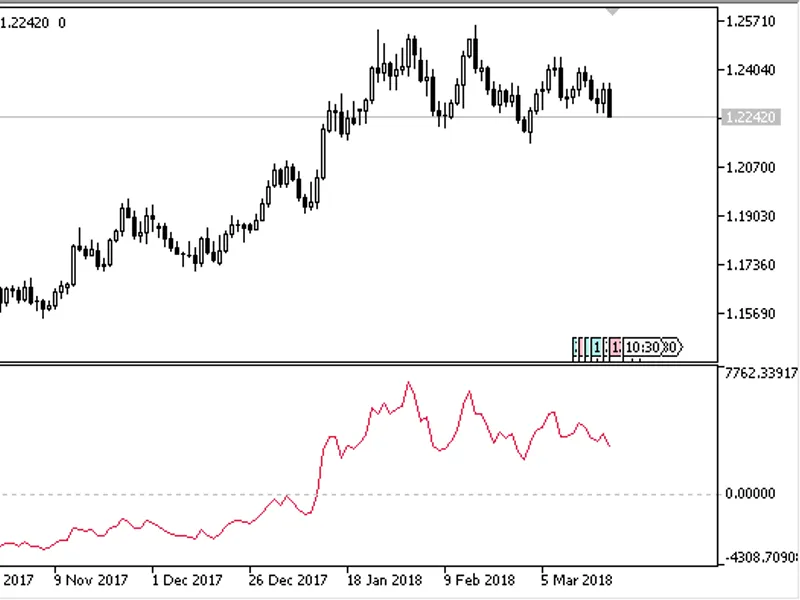
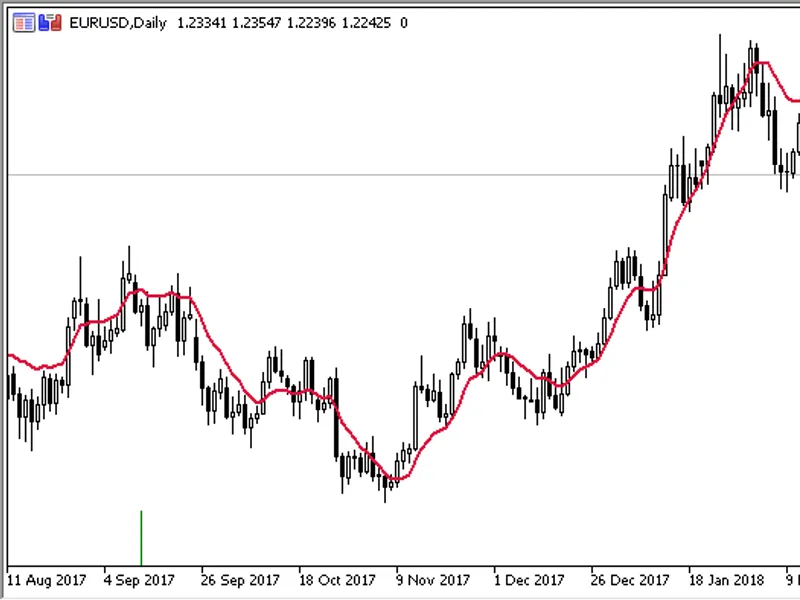
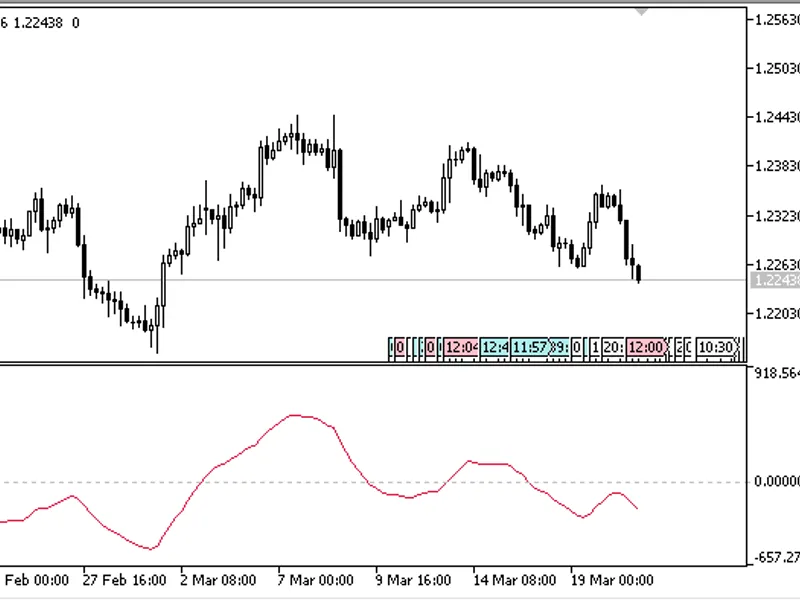
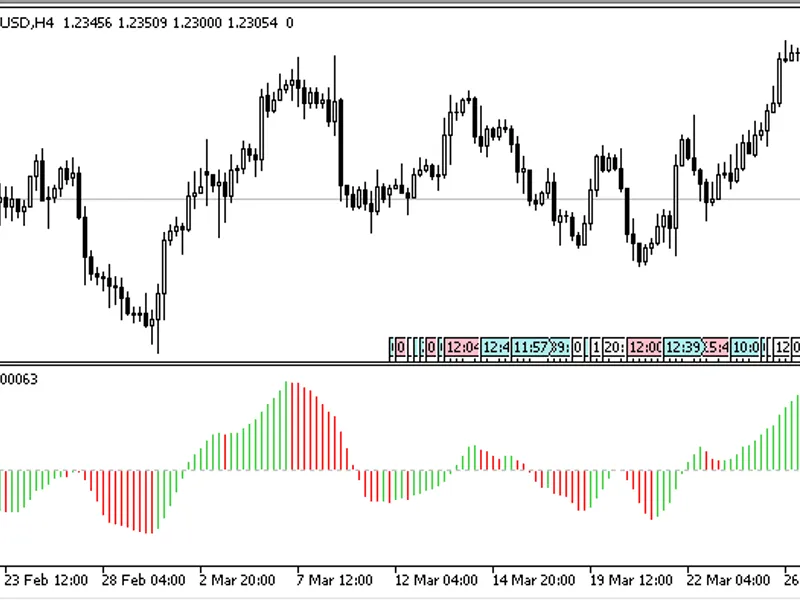
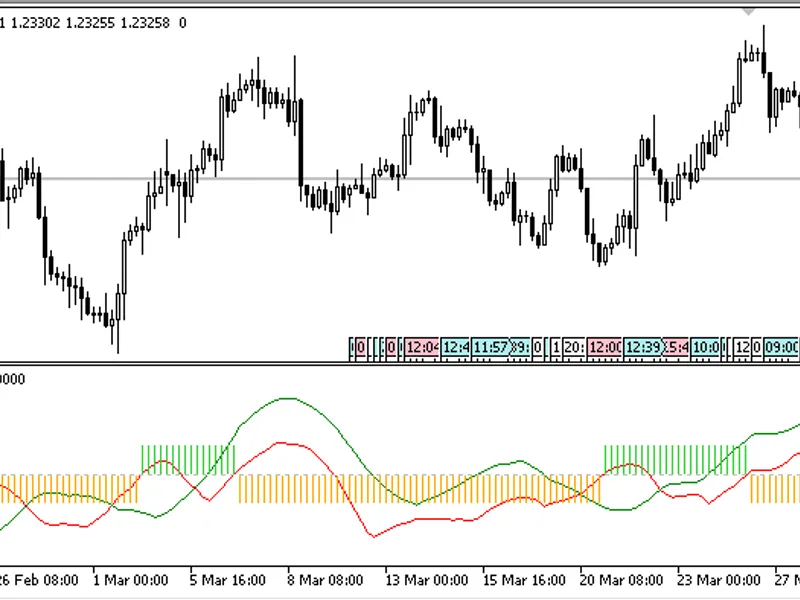
This indicator is based on the Moving Average (MA). Instead of displaying an average line, it presents colored bars on the chart, aiding in the evaluation of the current trend. The...
This indicator is designed as a multi-timeframe tool, supporting all possible timeframes in MetaTrader 5.It includes three special timeframes:- Next Higher Timeframe: The first hig...
This indicator is a multi-timeframe tool designed for MetaTrader 5.It supports all standard timeframes available in MT5, along with three special timeframes:- Next Higher Timeframe...
This indicator supports all timeframes available on MetaTrader 5, including three special timeframes:Next Higher Timeframe: The first higher timeframe relative to the active chart....
A collection of four digital filters designed for seamless integration with your main chart.Filter types:- FATL: Fast Adaptive Trend Line- SATL: Slow Adaptive Trend Line- RFTL: Ref...
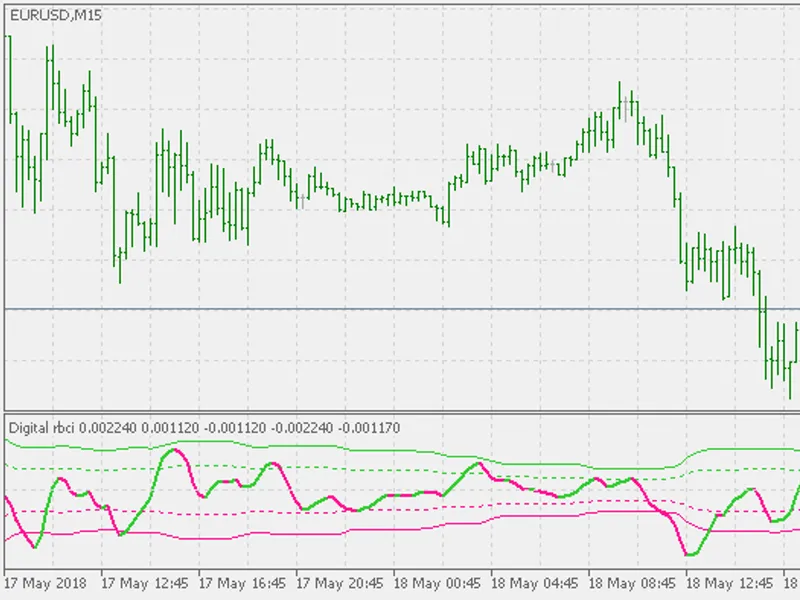
A collection of digital filters designed to be displayed in a separate window, catering to specific trading requirements.FTLM - Fast Trend MomentumSTLM - Slow Trend MomentumRBCI - ...
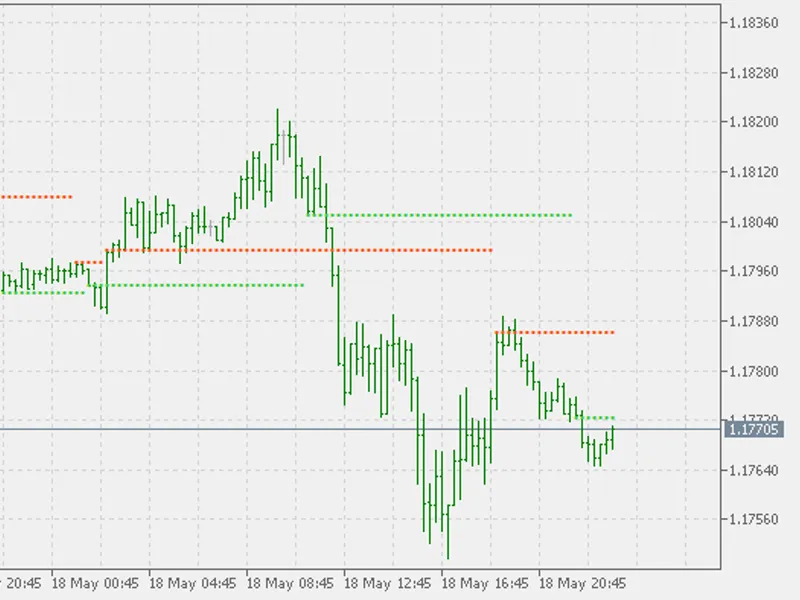
WPR (Williams Percent Range) based support/resistance indicator.When the WPR significant level (adjustable in parameters) is broken, the indicator initiates a new support or resist...
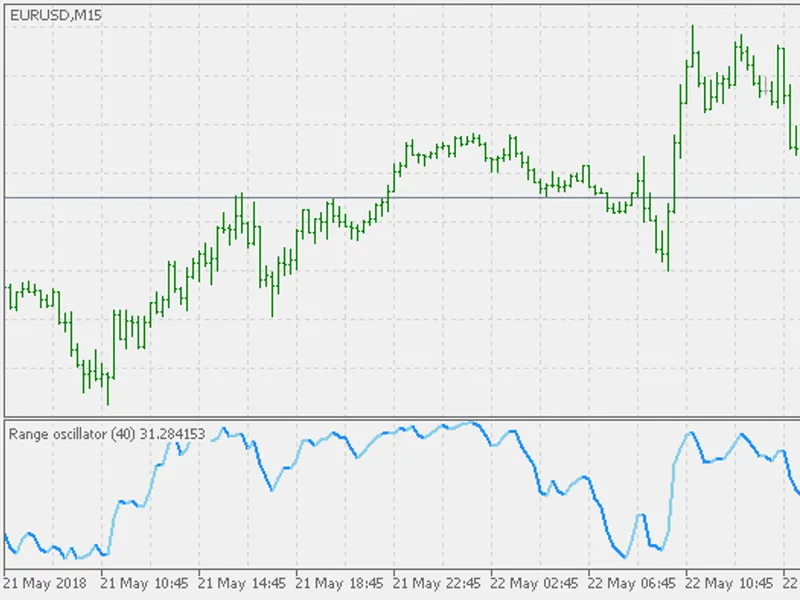
An indicator similar to the 'raw' Stochastic and Williams Percent Range.The Range Oscillator displays the relative position of the median price within the highest high to lowest lo...
The Range Oscillator is an indicator that illustrates the median price's position within the range of the highest high and lowest low for a specified period.It provides a visual re...
This indicator is designed to provide a comprehensive view of market trends and conditions. By utilizing dynamic levels that adapt to market fluctuations, it offers a versatile too...
This indicator, as described in the May 2022 edition of Technical Analysis of Stocks & Commodities, is an enhancement to the traditional RSI for detecting cyclical reversals.The in...
This indicator displays two states:- State Up- State DownIts simplicity makes it ideal for scenarios where direct access to indicator values is necessary, such as in expert systems...
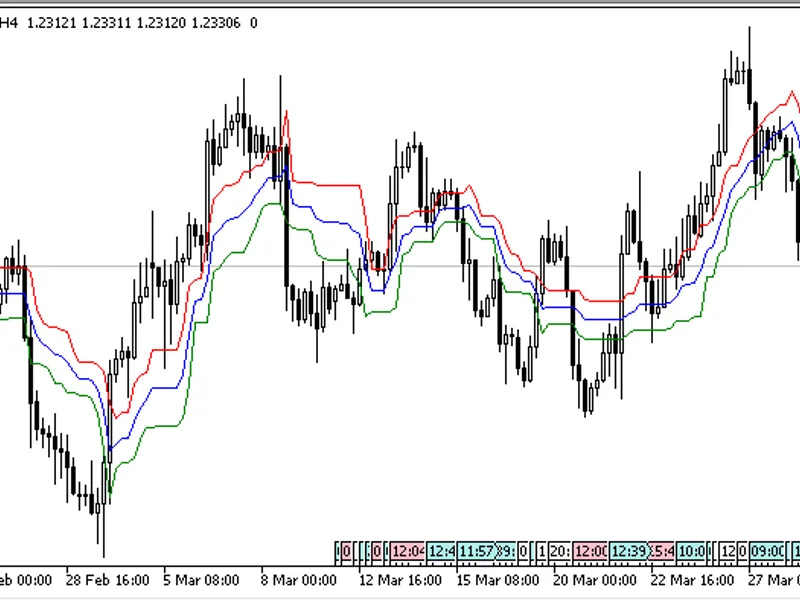
Bollinger Bands are a popular technical analysis tool that provides a relative definition of high and low prices. The bands consist of a central N-period moving average (MA), an up...
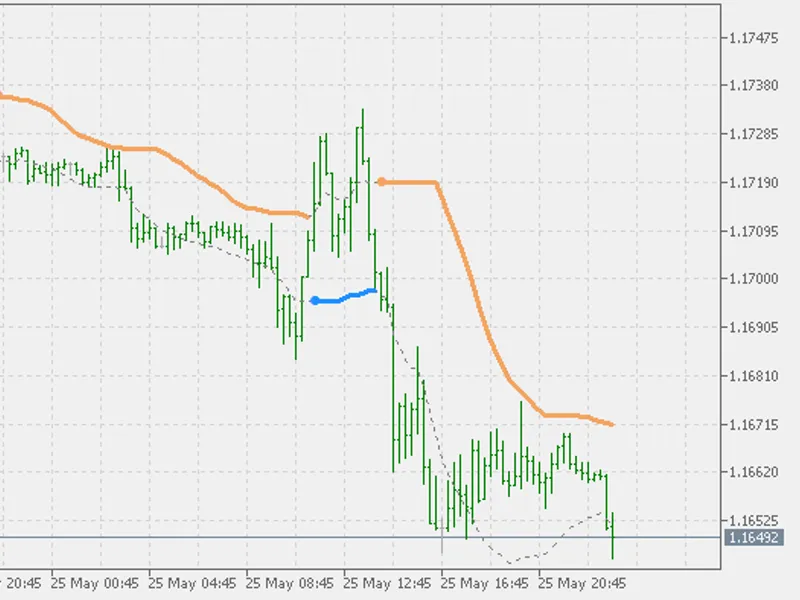
The BB Stops - EM Deviation Indicator is a trading tool designed for the MetaTrader platform. It offers reliable functionality to support traders in their analysis and decision-mak...
The Synthetic Vi X indicator is based on an article by Larry Williams, titled "Fix the Vi X" in TASC.Note: Synthetic Vi X is not a directional indicator. It indicates the increase ...
The Standard Deviation (SD), represented by the Greek letter sigma (σ) or the Latin letter s, is a measure of data variation or dispersion. It quantifies the amount of variation in...
This indicator is based on Patrick E. Lafferty's TASC article, "The Endpoint Moving Average" (2026).The Endpoint Moving Average (EPMA) is a technical analysis tool that calculates ...
Indicator combining two well-known indicators: CCI and Stochastic.This indicator is a Stochastic of CCI. One possible issue with CCI is that it does not have known bounds for level...
The Mesa Adaptive Moving Average (MAMA) is typically displayed on charts as two values, which can be confusing without proper context.The second value, as John Ehlers describes, is...
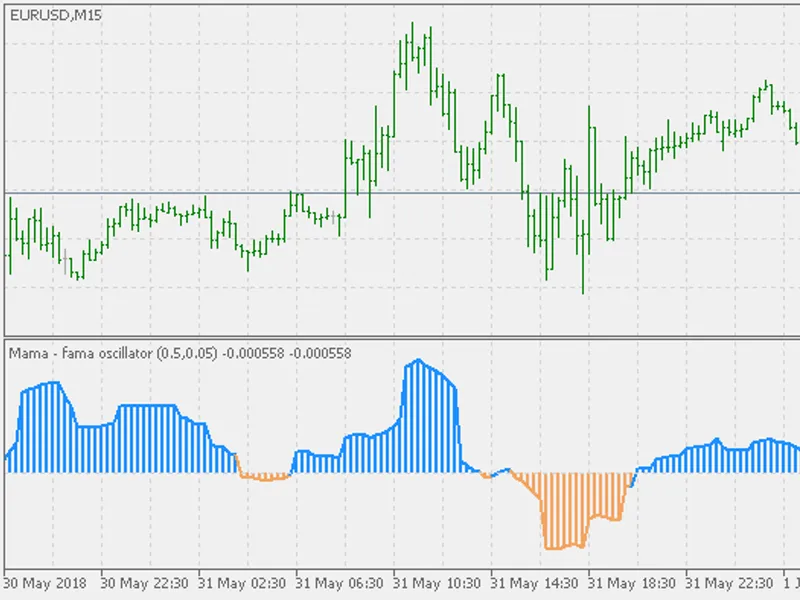
This indicator combines MAMA (MESA Adaptive Moving Average) and FAMA (Following Adaptive Moving Average) to create an oscillator.It functions similarly to other oscillators, genera...
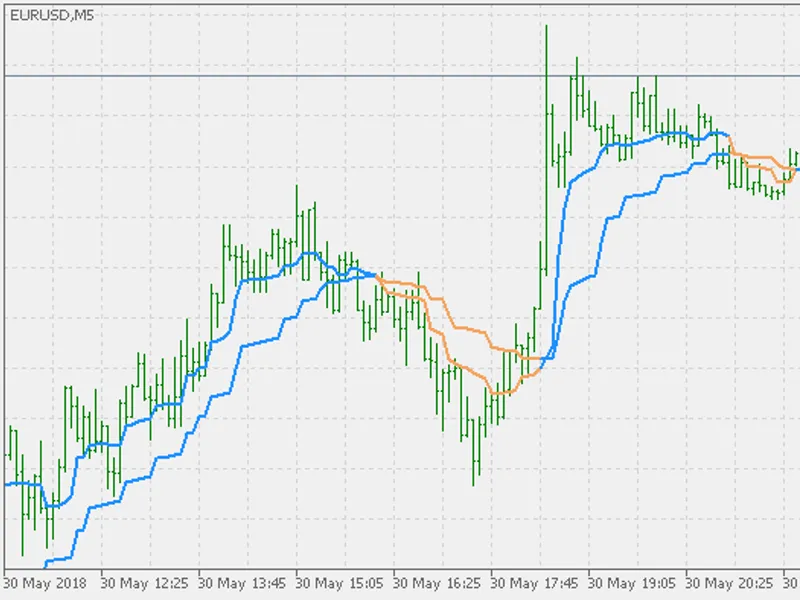
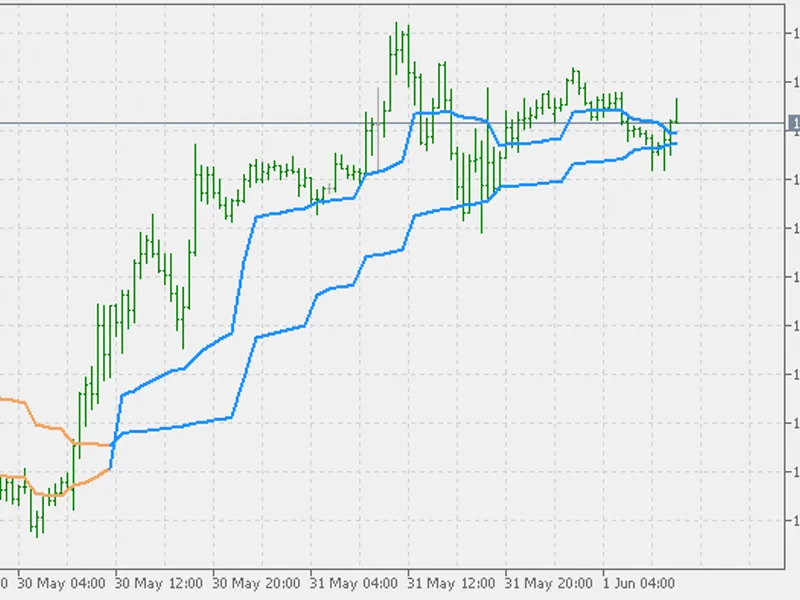
The Mesa Adaptive Moving Average (MAMA) and the Following Adaptive Moving Average (FAMA) combination is now available in a multi-timeframe version.This indicator supports all possi...
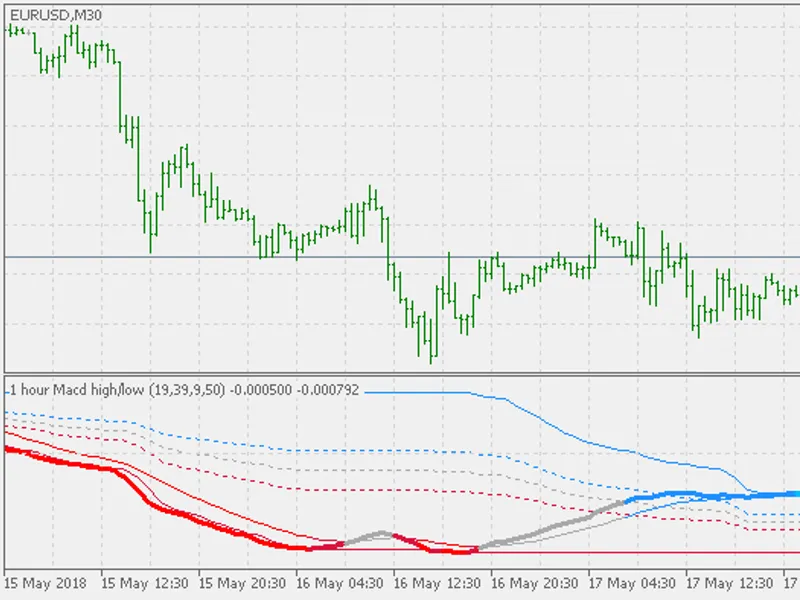
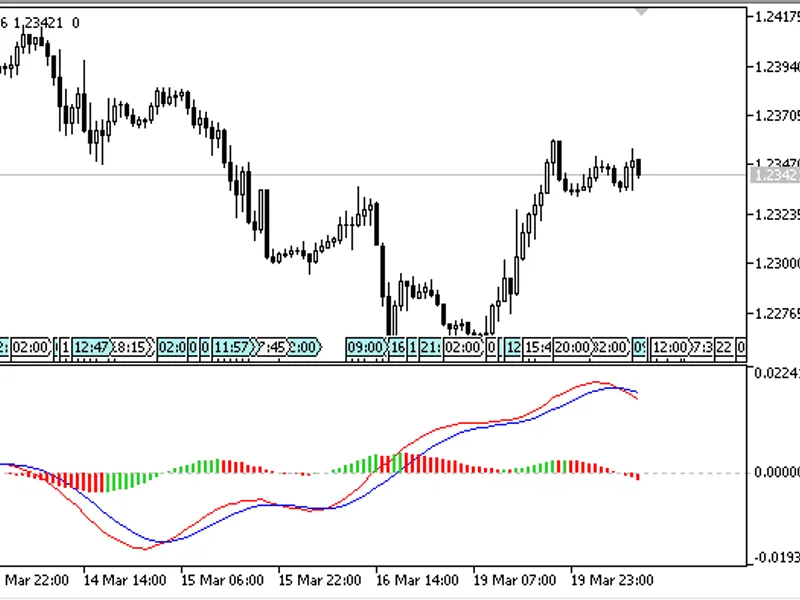
The LR MACD indicator is derived from a moving average constructed using the linear regression method (LSMA).This indicator has five input parameters:- Fast LSMA Period: The calcul...
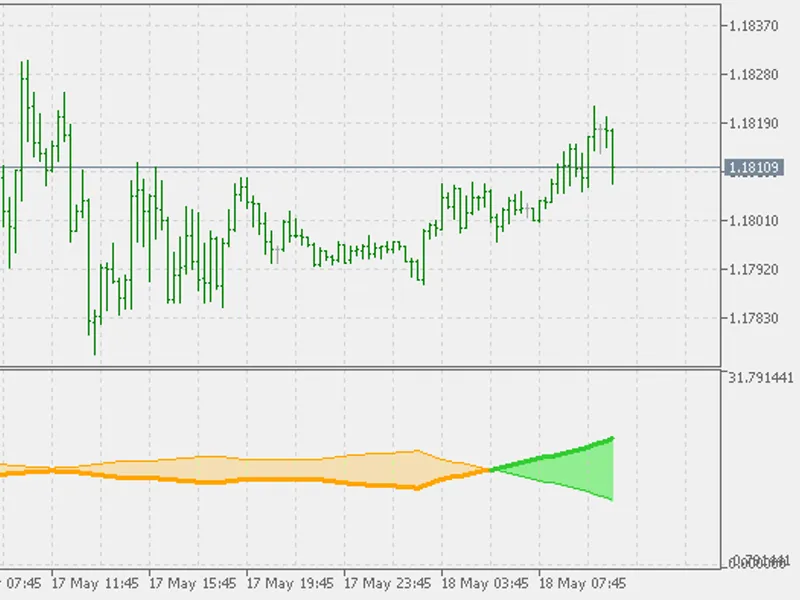
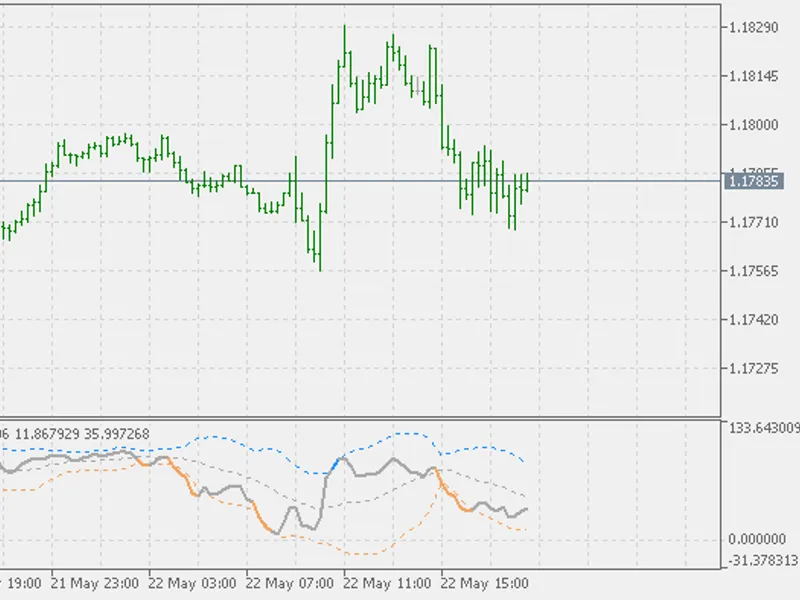
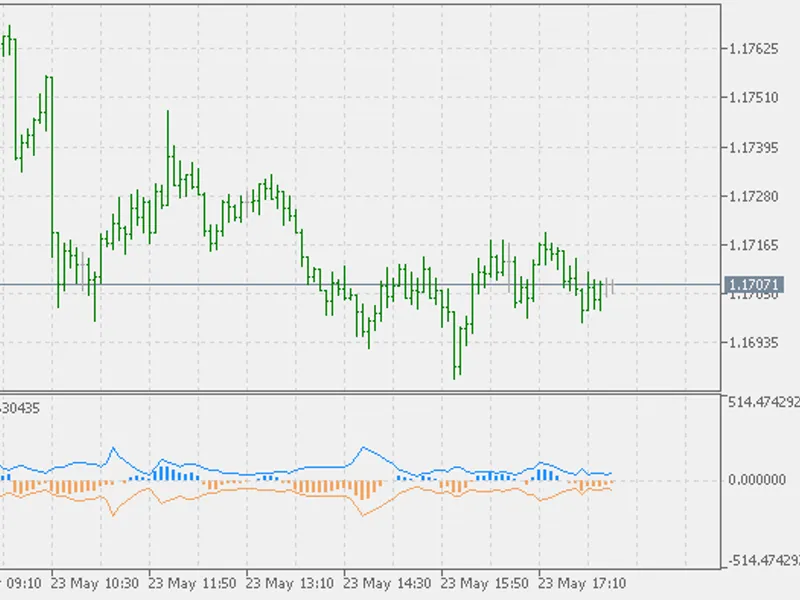
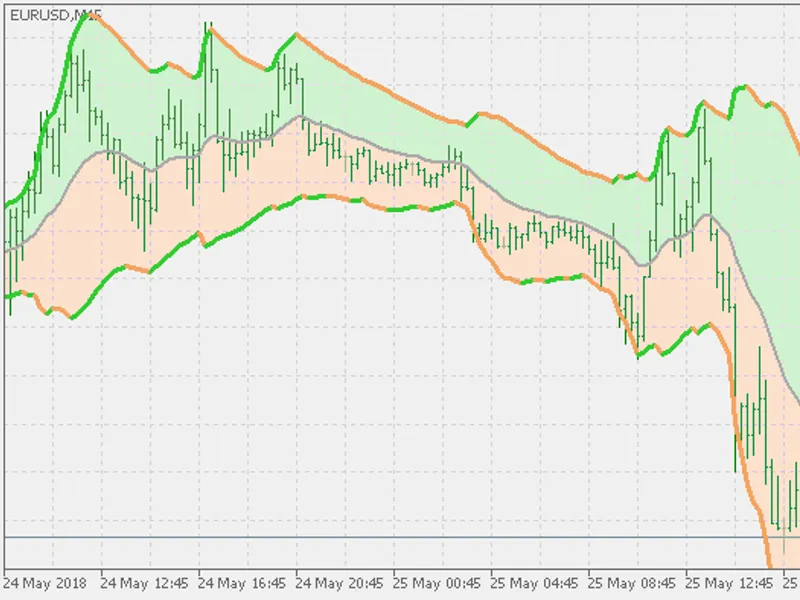
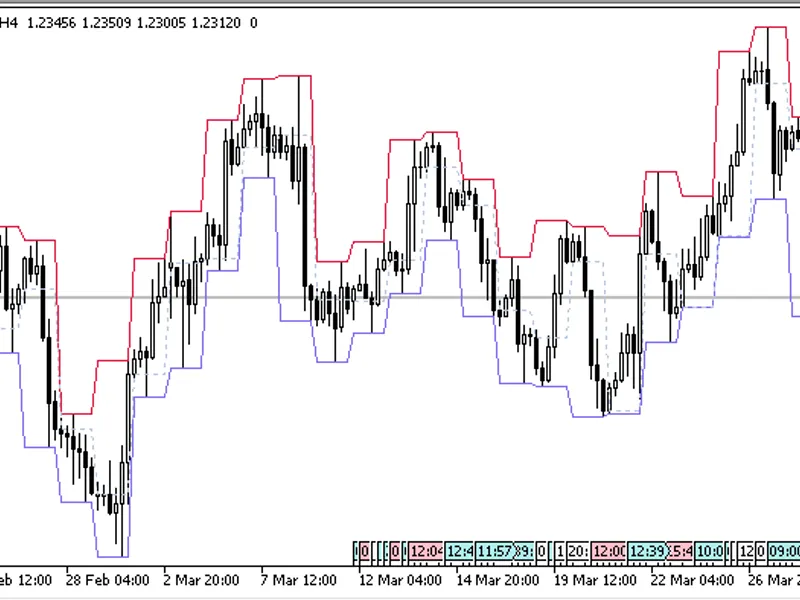
The HL MA Bands indicator is a unique combination of Bollinger Bands and envelopes, utilizing two moving averages derived from the Linear Regression method (LSMA).This indicator of...
The indicator is a variation of Bollinger Bands and Envelopes, utilizing two smoothed moving averages derived from the Linear Regression method (LSMA).It offers two customizable pa...
This oscillator indicator offers a unique approach to visualizing volume data, presenting the total volume over a specified period.Volume data can be displayed in various formats:C...
The MA Difference trend indicator calculates and displays the absolute difference between:Price and MA1Price and MA2MA1 and MA2This indicator has nine input parameters:- MA1 period...
A simple indicator that displays the opening price of a specified period on the chart.This indicator has one input parameter:Timeframe- Select the timeframe for which you want to d...
Price Volume Trend (PVT) is an indicator that combines price trend and volume, similar to the standard On Balance Volume (OBV) indicator.The PVT calculation adjusts the current val...
The Recursive Trendline (RTL) indicator displays the trend as a recursive line.It features two parameters:Period- Calculation periodApplied Price- Price utilized for calculations.T...
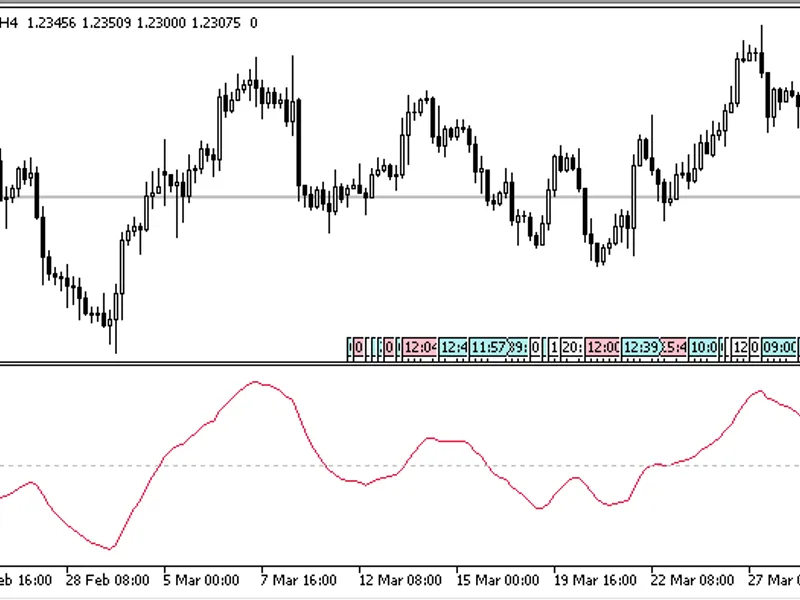
The TOSC Oscillator Indicator is a powerful tool for traders, displaying the difference between the exponential moving average and the price.This indicator offers two customizable ...
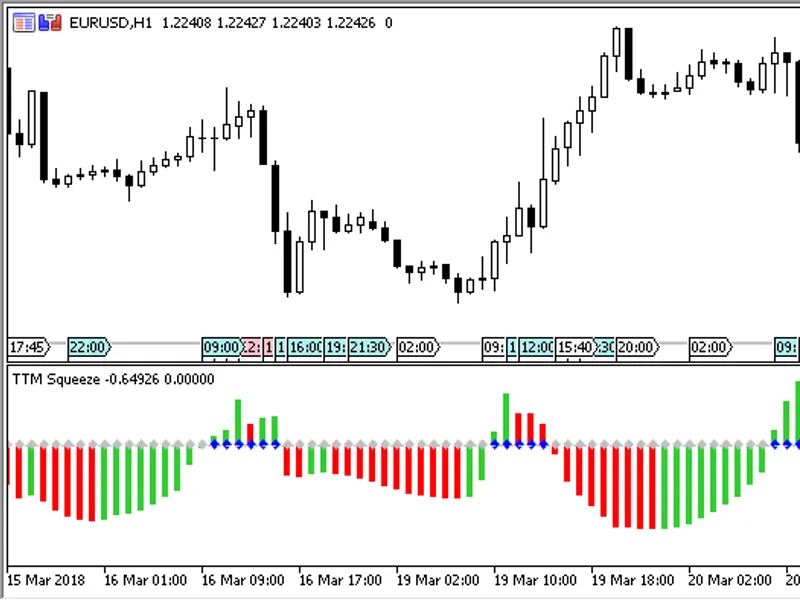
The TTM Squeeze Indicator is designed to identify optimal trading opportunities by focusing on the relationship between Bollinger Bands and Keltner Bands.This indicator is presente...
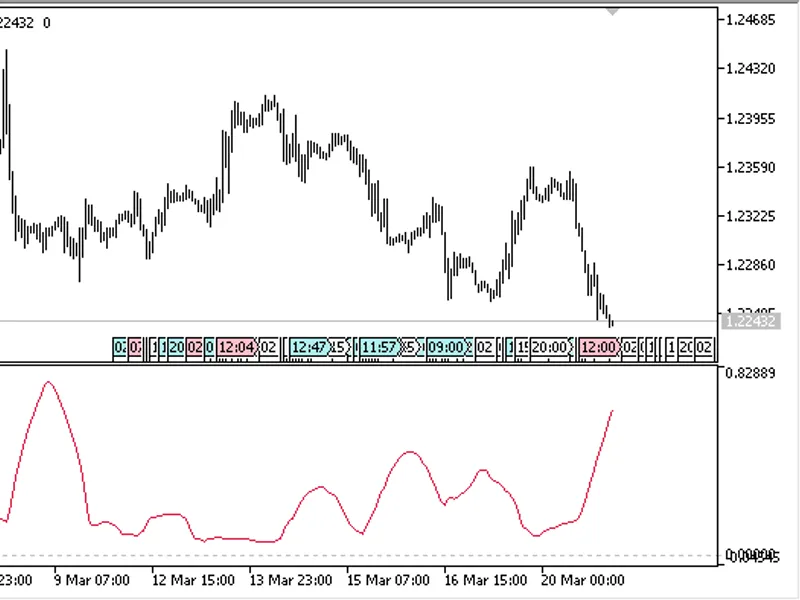
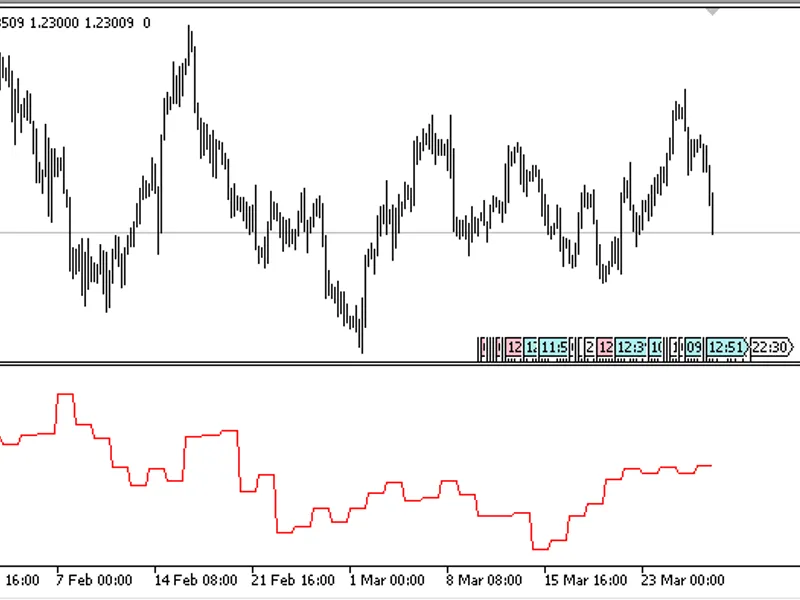
The Ulcer Index (UI) is a volatility indicator that measures the potential for a decrease in volatility, suggesting a possible drawdown or recovery within a specific period.This in...
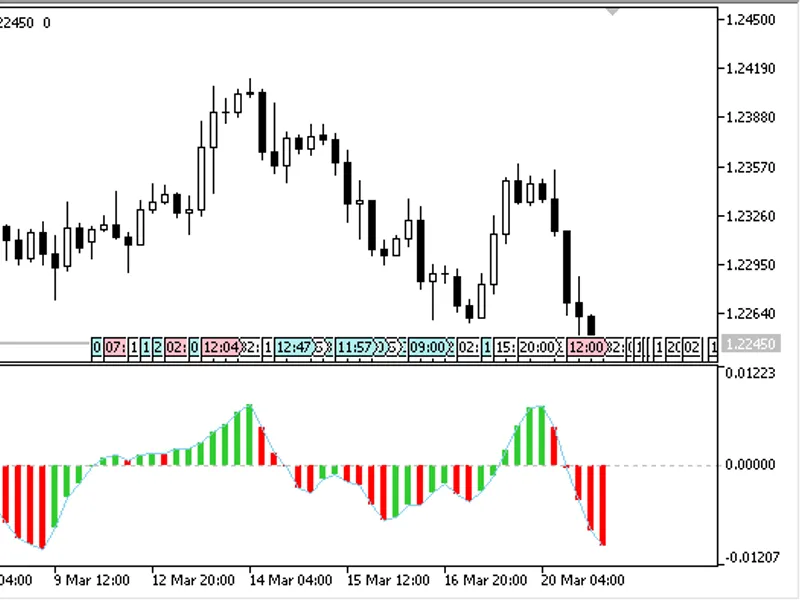
This indicator is a powerful tool for traders, offering a unique perspective on market trends and potential reversals.The JP Oscillator is calculated using a specific formula:JPO =...
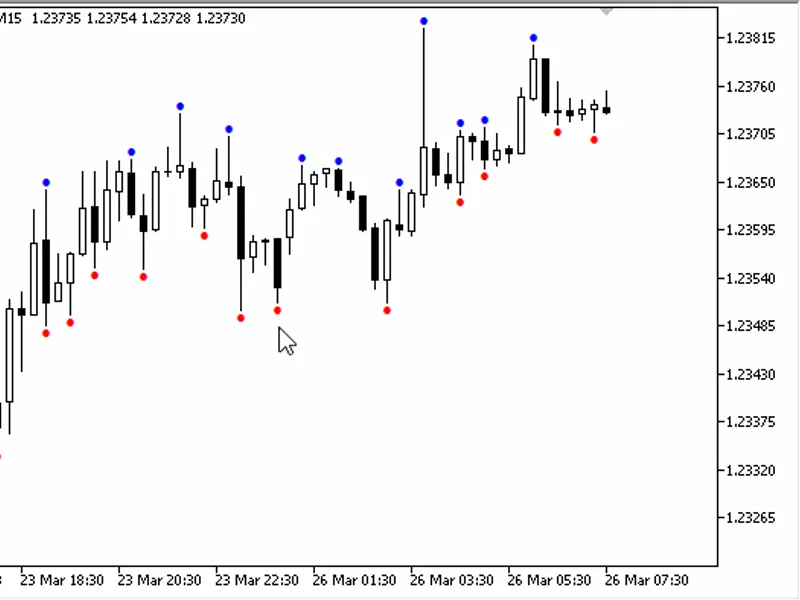
The Highest Lowest indicator identifies bars with unique characteristics, specifically those with a high above the highs of neighboring bars and a low below the lows of neighboring...
The HL Bands indicator is a versatile tool for visualizing price levels on the chart.It displays the open, high, and low values of a specified period, offering two display modes:- ...
The indicator displays the average range for a specified period, offering insights into market volatility.Range Types:- High/Low- Open/CloseRendering Modes:- Absolute Values- Relat...
This indicator is a customizable version of the Awesome Oscillator (AO), allowing you to tailor its parameters to your trading strategy.You can adjust the following:- MA Fast Perio...
The Detrended Synthetic Price Oscillator (DS P) is a technical indicator that reveals price movement trends while excluding the trend component. It is derived from the difference b...
The Point of Balance indicator is a powerful tool for traders, offering insights into market trends and potential reversal points.This indicator is calculated using a precise formu...
The indicator is presented as two lines and a histogram:TD Index- The trend indexDirection- Trend direction lineSignal- Trade direction histogram.It has two parameters:Period- Calc...
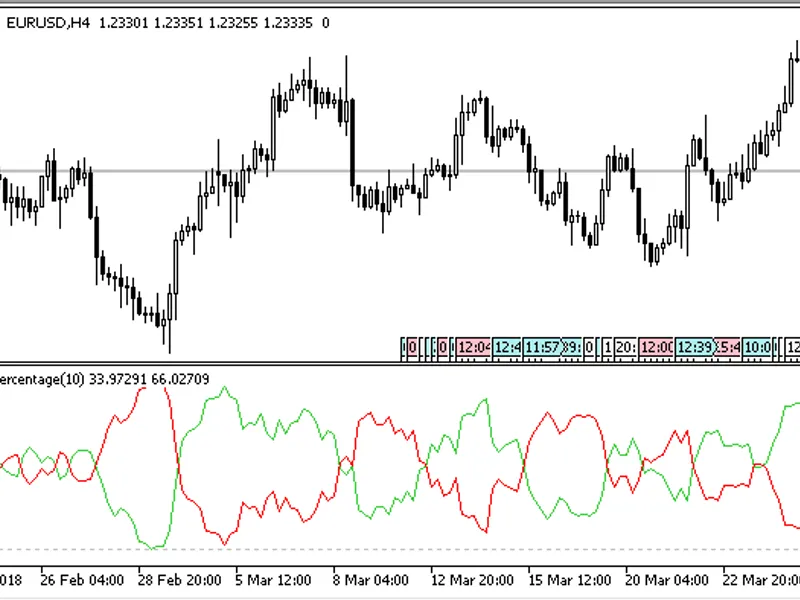
This indicator calculates and displays the percentage of bullish and bearish bars within a specified interval.Key Features:- Period: Set the calculation period for the indicator.- ...
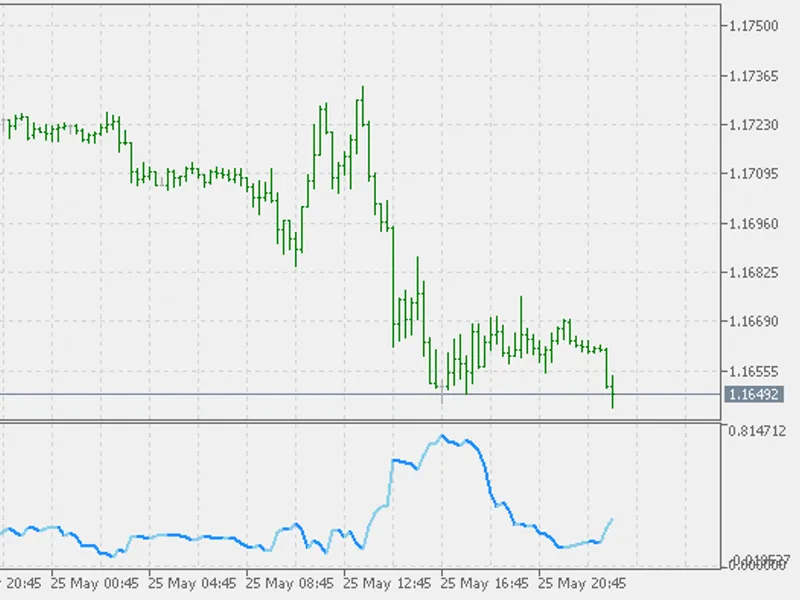
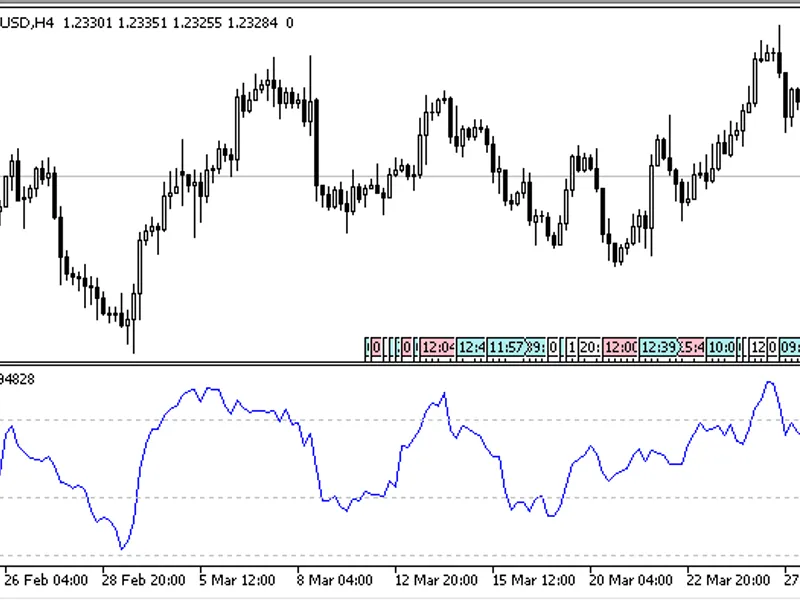
The indicator displays the unsmoothed RSI on a separate chart window, offering a unique perspective on market trends.Key Features:- **Period**: Adjust the calculation period to sui...
The Velocity/Acceleration Oscillator is a powerful tool for traders, offering insights into market momentum.This indicator provides three key parameters for customization:- Velocit...
The Volatility Index Oscillator (VIX) is a powerful tool with two key parameters:- Period: The calculation period, with a default value of 22.- Drawing Style: Choose between a line...
The indicator displays the relationship between two moving averages, each computed using distinct high/low and open/close values over a specified period.This indicator includes one...
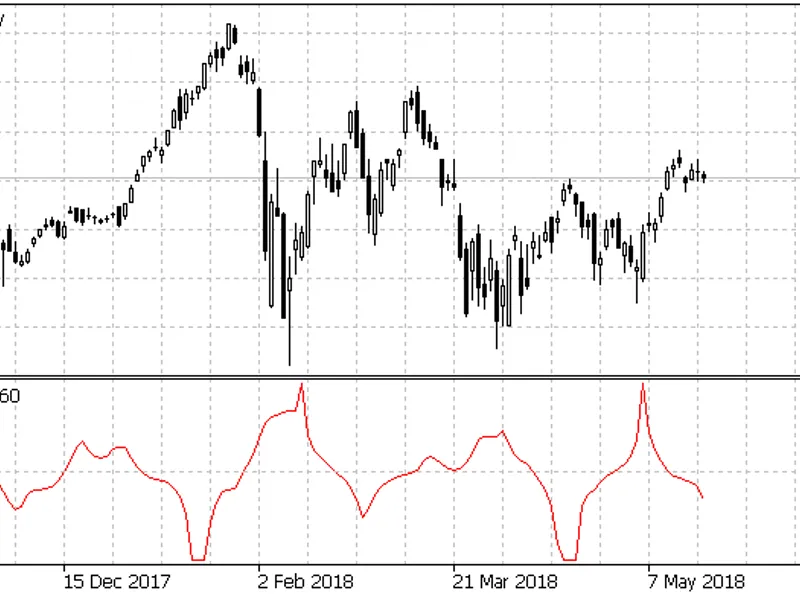
This indicator predicts potential price reversals. When the indicator line reverses, it suggests an impending change in the price direction.The indicator is customizable with the f...