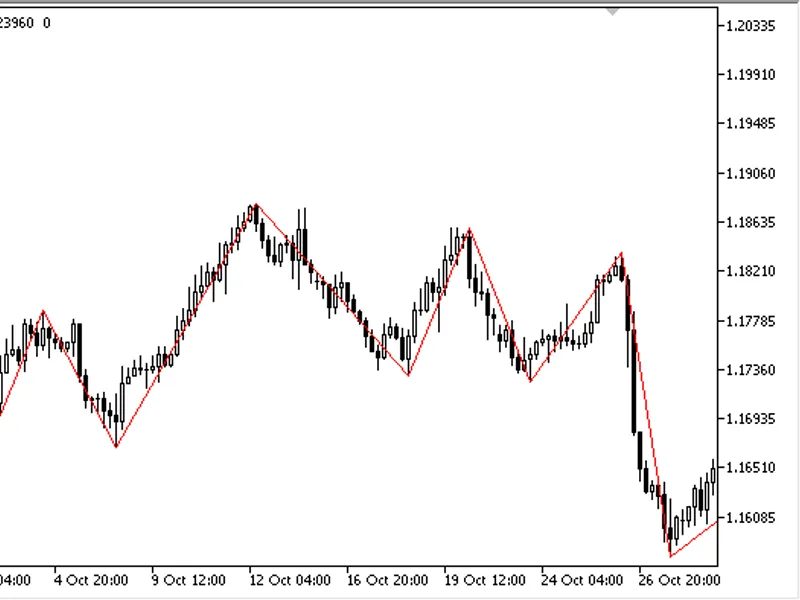
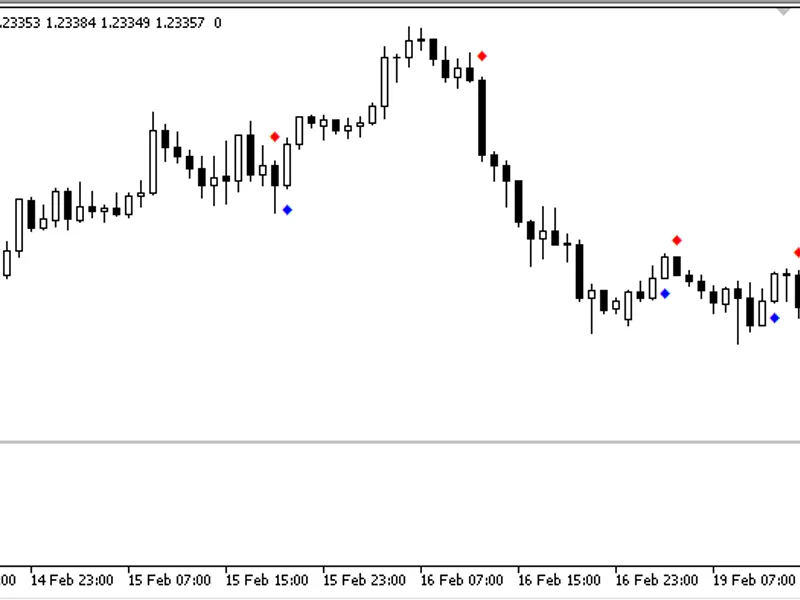
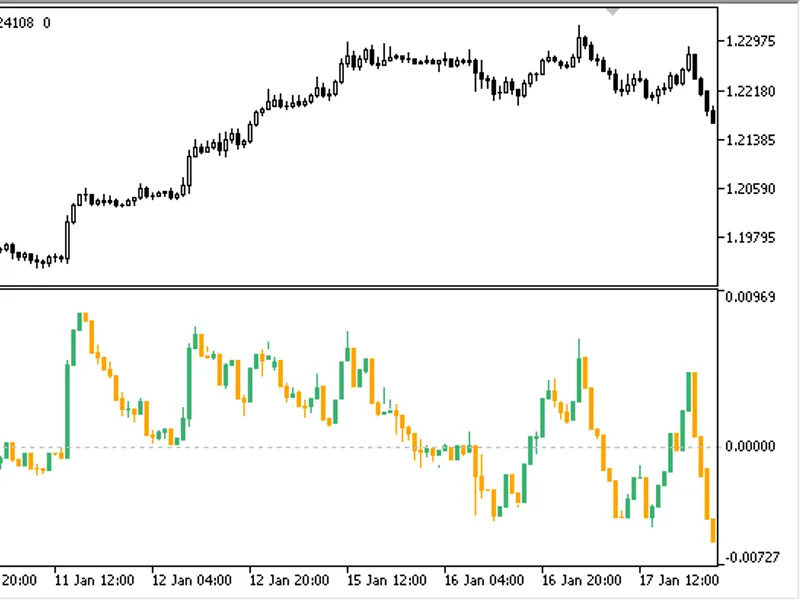
The indicator draws a simple zigzag on the price chart, requiring only the step value as input. Break points are added when the zigzag leg length exceeds the specified step.The ind...
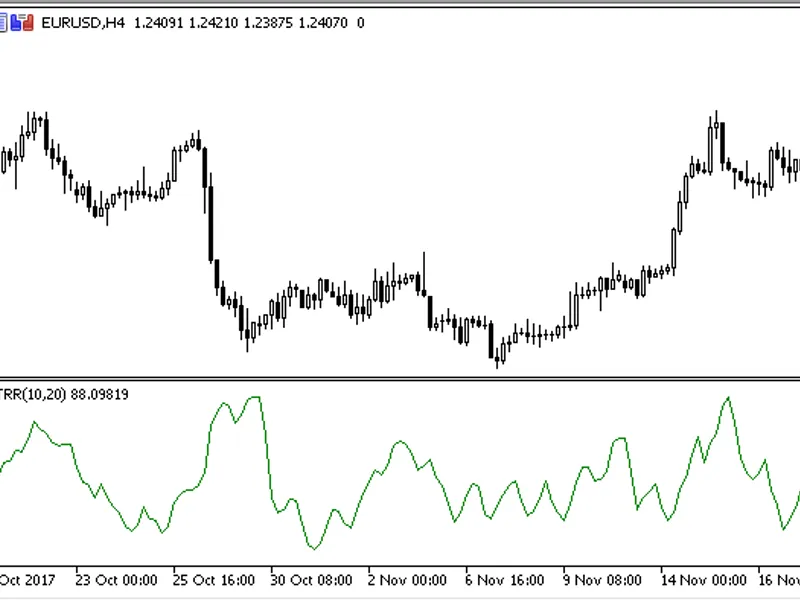
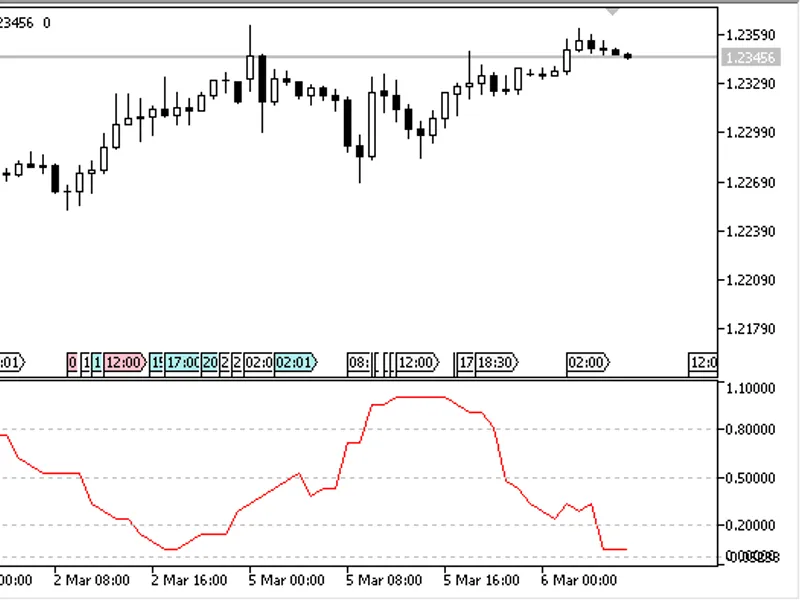
The indicator displays the ratio of two Average True Range (ATR) values with different periods.The formula is:ATR Ratio = (ATR1/ATR2) * 100Parameters:- ATR1 Period: ATR1 calculatio...
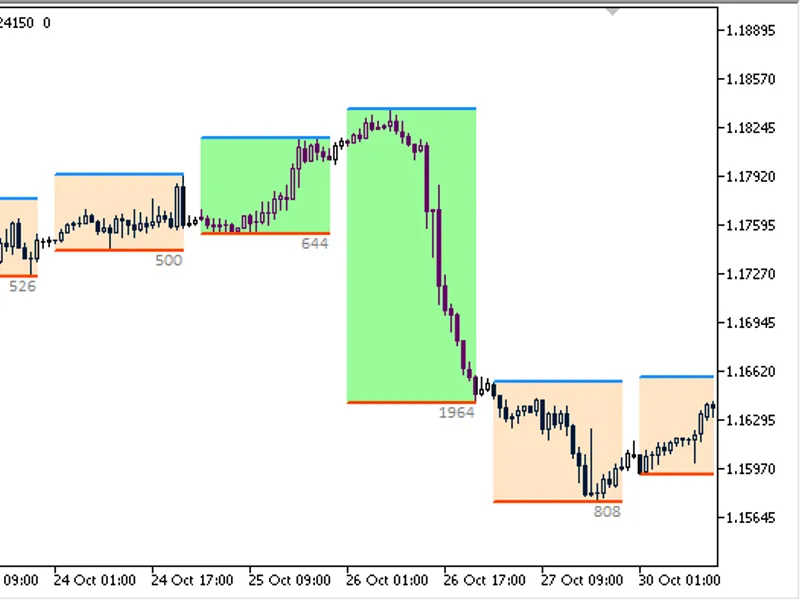
The indicator displays the previous trading day's channel on the chart, allowing for the customization of trading day start and end hours. Channels are color-coded based on their s...
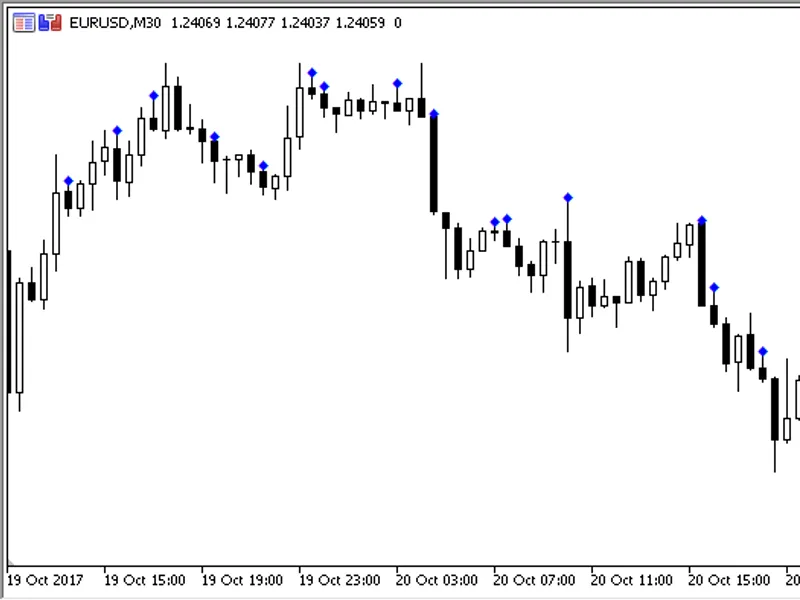
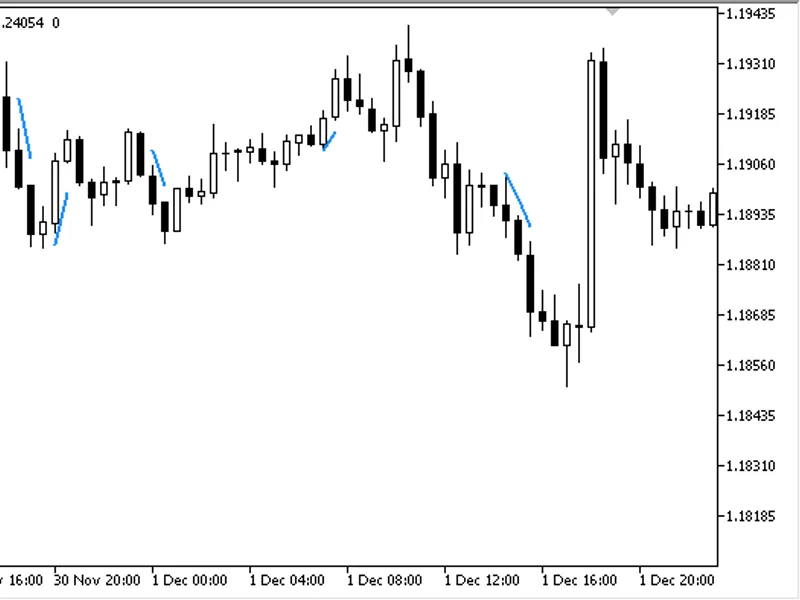
The indicator identifies and displays custom patterns on a chart based on the settings provided. These patterns are defined using a text code, where:- u represents a bullish candle...
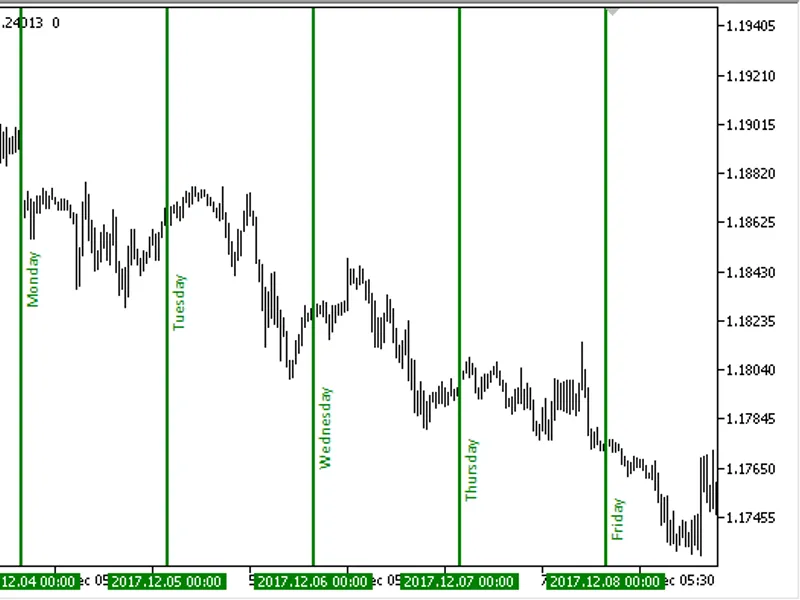
The indicator displays the days of the week, months, and years as lines and text labels on the chart.It offers a comprehensive set of customization options with 31 input parameters...
The KoT (Keep On Trading) indicator provides guidance on when to hold or close a position. When there is an open buy position, the indicator displays a line below the price, indica...
This indicator calculates and displays overbought and oversold levels in a separate window, using a moving average relative to the Average True Range (ATR).The formula is as follow...
The PMF (Pivot Money Flow) indicator is a powerful tool for traders, providing insights into the direction and reversal of money flows.This indicator offers two key parameters to c...
The indicator is similar to the standard MACD, but it is calculated using both MACD and SAR, providing more confident signals in trend areas. Overbought/oversold levels help track ...
A simple oscillator based on the values of three indicators: Istochastic, IRSI, and IMomentum. It is displayed as a two-coloured histogram.The indicator calculation formula is:Kwan...
The XRSIDEMARKER Histogram is a color histogram that displays a non-trivial linear combination of IRSI and IDEMARKER, two popular indicators in the MetaTrader 4/5 platform.Indicato...
The XRSI Marker Histogram HTF indicator offers the flexibility to modify the indicator's timeframe through input parameters.To activate the indicator, ensure the xrsidemarker_histo...
The Kwan NRP HTF indicator offers the flexibility to modify the indicator's timeframe through input parameters.To activate the indicator, place the kwan_nrp.ex5 indicator file in t...
This indicator is an enhanced version of the MACD with extended settings.In addition to the standard parameters, such as fast and slow Exponential Moving Average (EMA) periods, sig...
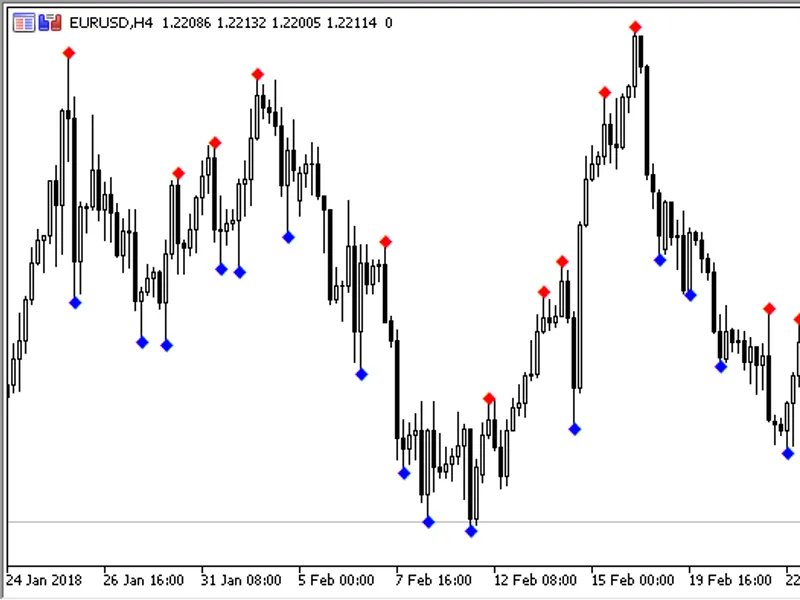
This indicator displays fractals with customizable dimensions on a price chart. Unlike traditional fractals with fixed dimensions like 2x2 or 3x3, this tool enables the setting of ...
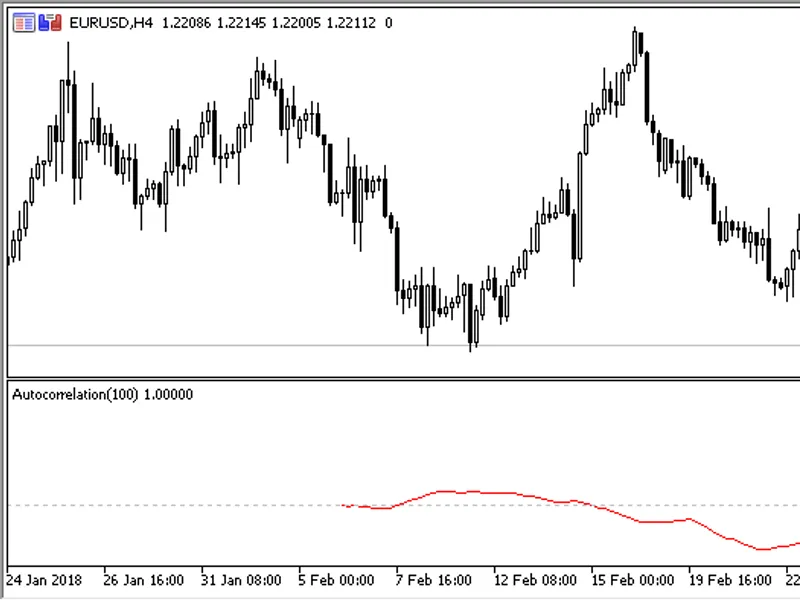
This indicator calculates and visually represents the autocorrelation function on a chart, illustrating the relationship between a function (signal) and its shifted copy based on t...
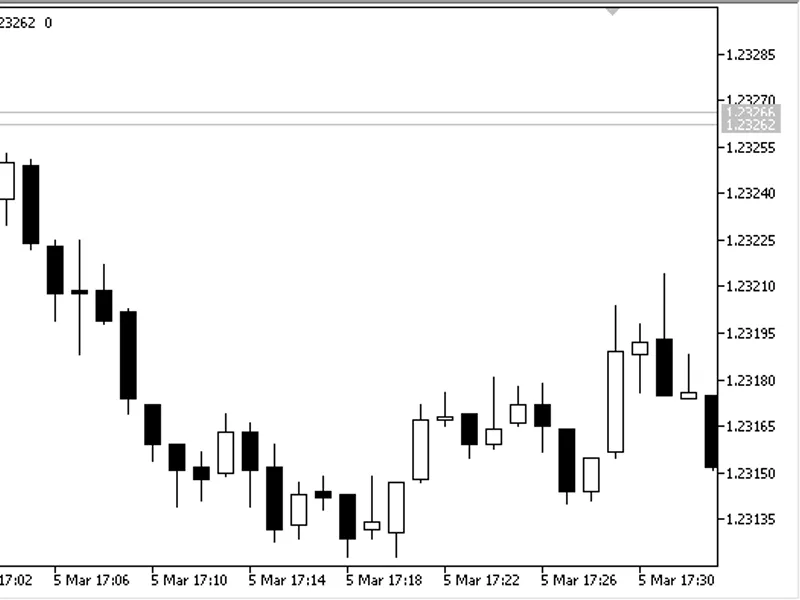
The indicator identifies and highlights the 'Inside Bar' pattern on the chart. This pattern consists of two candlesticks, where the current candlestick is contained within the prev...
The Special Slow Stochastic (SSS) indicator is an enhanced version of the standard stochastic oscillator. It introduces an additional smoothed line, providing a more refined analys...
This indicator offers three calculation methods:- Classical- Classical Incremental (standard in the terminal)- Trade Station Incremental (calculation with an increment like Trade S...
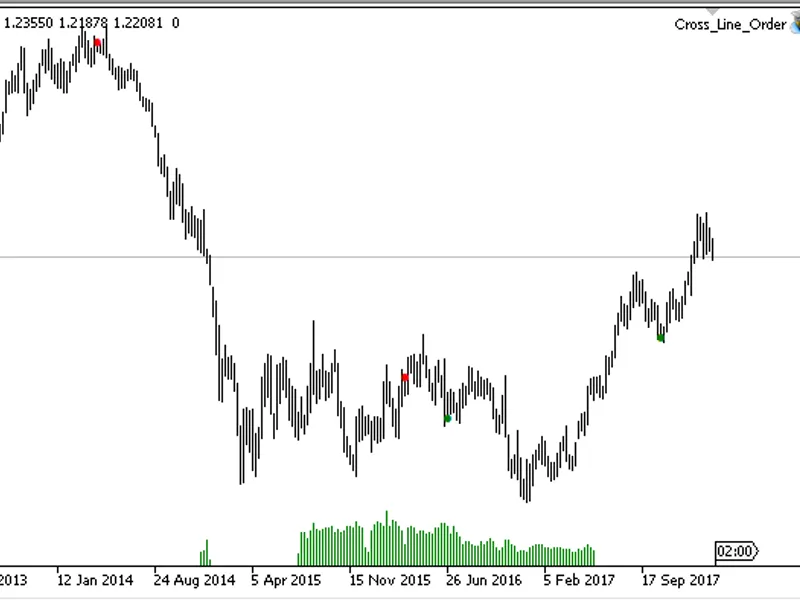
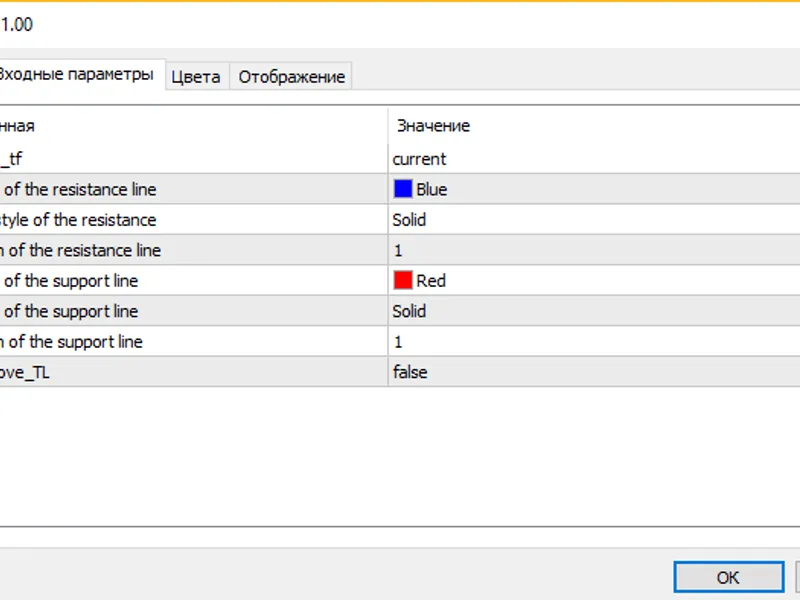
An indicator for automatic trendline drawing based on fractals of a specified timeframe.Input Parameters:base_tf- The timeframe for fractal calculation, which determines the trendl...
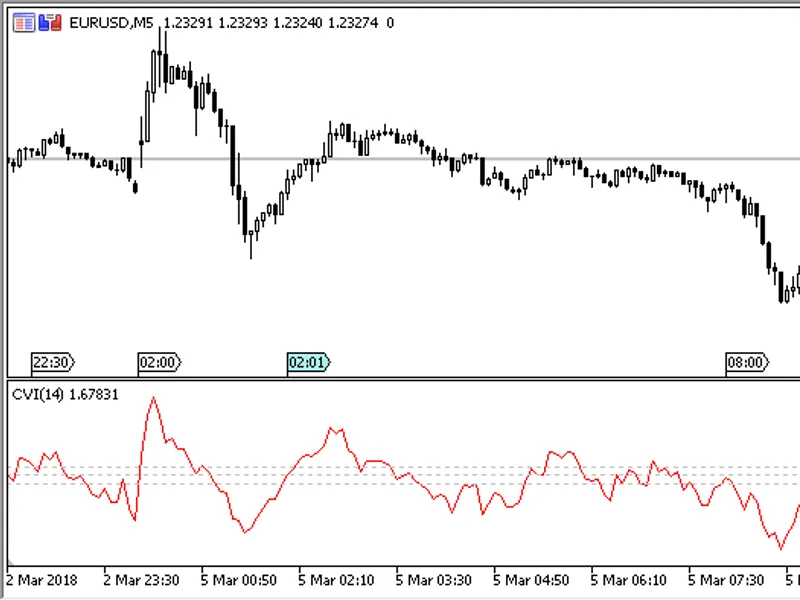
The CV Indicator is an oscillator that displays the price deviation from the moving average, considering the Average True Range (ATR).Calculation Formula:CVI = (Close – MA) / ATRMo...
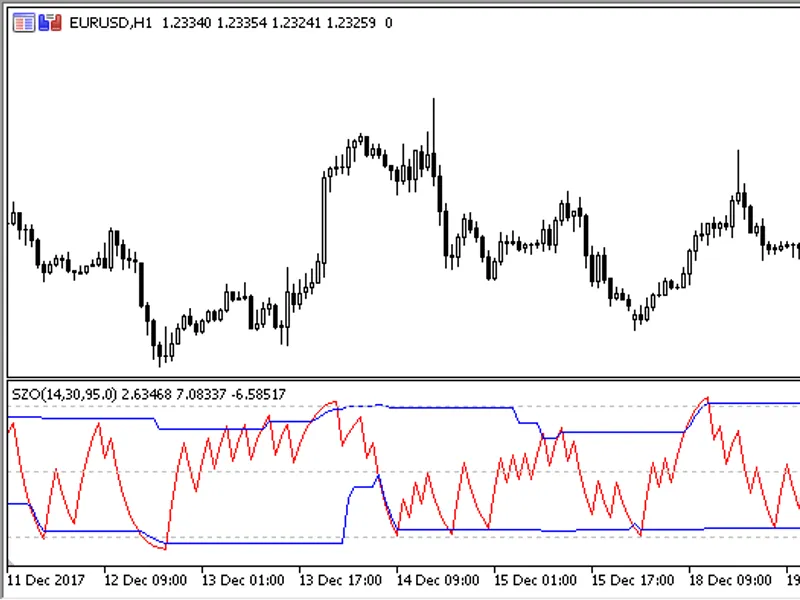
The SZO (Sentiment Zone Oscillator) indicator displays market sentiment (activity and direction) and zones of excessive activity (overbought/oversold zones). It can also show a dyn...
The Gap Finder indicator is a powerful tool for identifying and visualizing price gaps between consecutive bars on a chart.Key Features:- Gap Detection: Identifies gaps between the...
The Trend Range indicator is a powerful tool for visualizing market trends and identifying potential trading opportunities.It displays a histogram with three distinct market states...
The indicator adds signal marks to a price chart when the CCI crosses its zero line. If CCI crosses the zero line upwards, a dot is placed below the candlestick. If it crosses down...
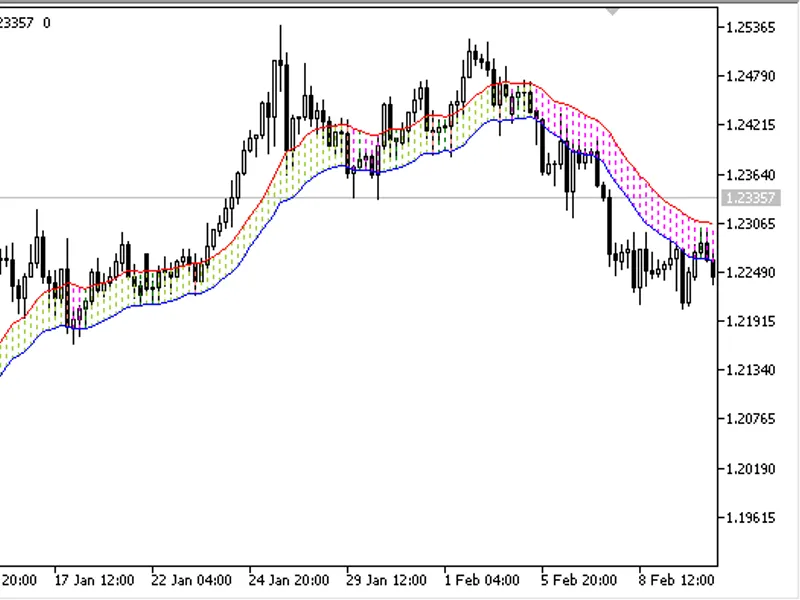
The indicator visualizes the price range between two moving averages as a colored area on the chart.Parameters:- MA Period: Set the calculation period for the moving averages.- MA ...
Two indicators in one: momentum and stochastic.This versatile indicator offers two modes: Average Stochastic Momentum (ASM) and Stochastic Momentum (SM).ASM applies smoothing, whil...
The idayiindex (intraday intensity index) oscillator indicator.It is calculated using the following formula:iii = sum((2c-h-l)/(h-l))*tickvolume normalized:normalized iii = (iii /s...
VSI is a volatility indicator that assesses current market volatility relative to historical data over a specified period. It provides a normalized range of values from 0 to 1, ena...
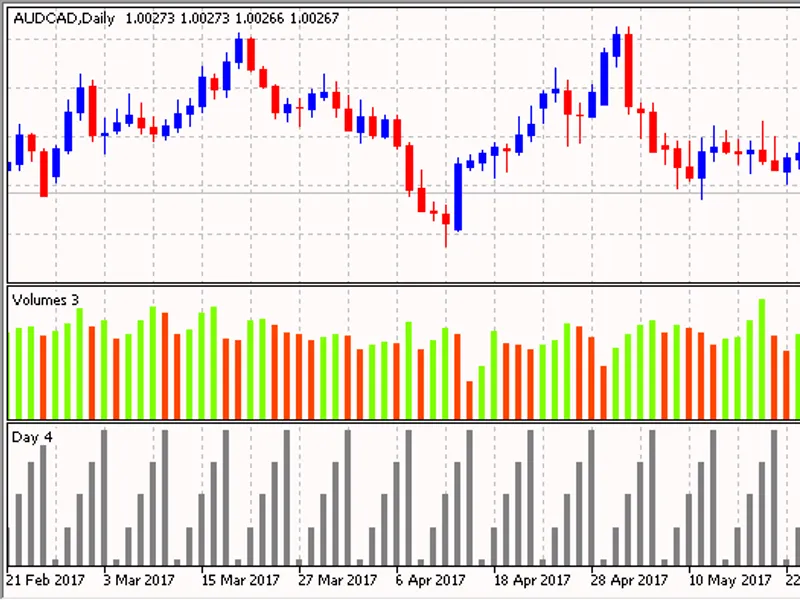
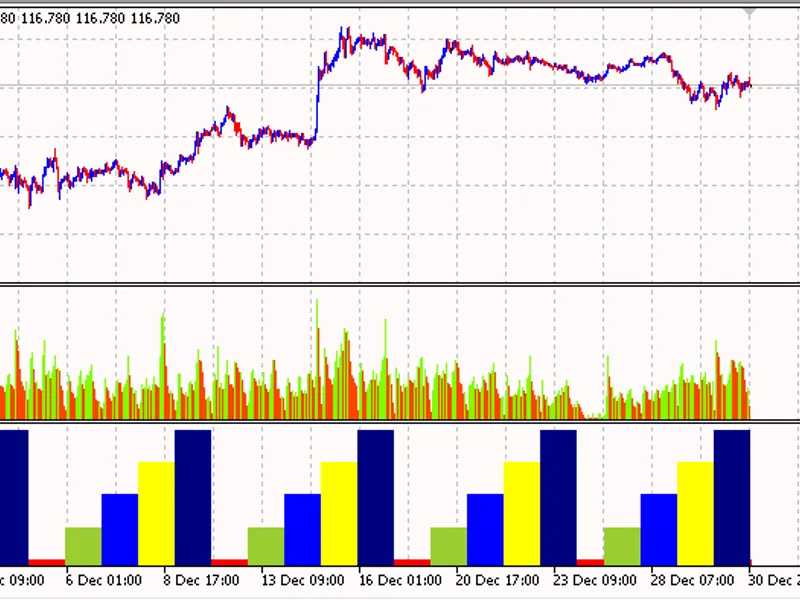
The indicator displays the current day of the week as a histogram, with the histogram rule corresponding to the day numbering in the structure.This indicator can be utilized on the...
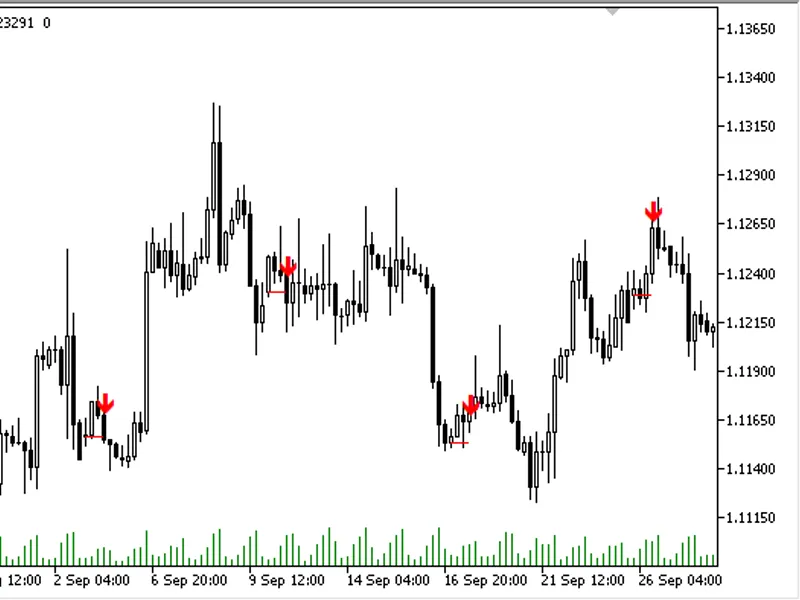
This indicator adds signal arrows on a specific day of the week and time.If the close price of the candlestick preceding the given one is lower than the open price of the specified...
This style requires two buffers: a values buffer (histogrambuffer) and a color buffer (histogramcolors).Colors are set in the line where color clrcyan has index "0", clrred has ind...
Detrended Price Oscillator BarThis oscillator indicator removes the trend component from the price movement chart, making it easier to identify price fluctuation cycles and overbou...
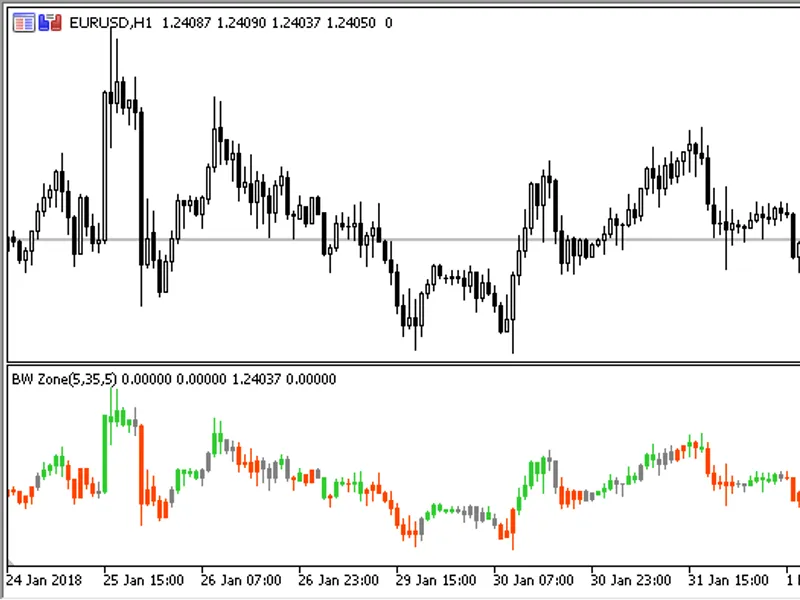
A modified indicator based on Bill Williams' zone trading strategy.This indicator offers enhanced customization compared to the standard Awesome Oscillator (AO) and Accelerator Osc...
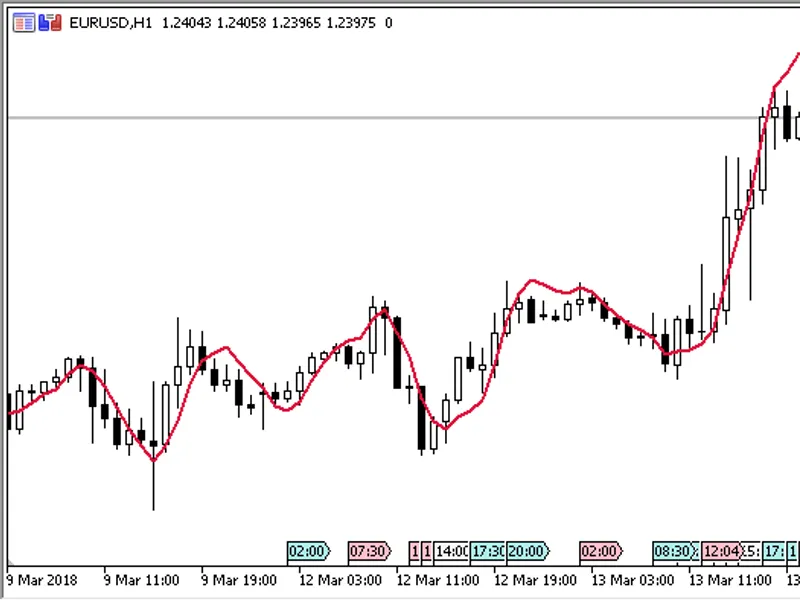
This indicator is a moving average based on Heiken Ashi candlesticks.It offers two customizable parameters:Period- The calculation period.Method- The calculation method.The indicat...
A moving average indicator based on linear regression.This indicator uses two input parameters:Period- The calculation period for the moving average.Applied Price- The price used f...
An oscillator indicator that displays the ratio of two moving averages. This indicator offers three customizable parameters:- Period LSMA First: The period for the first LSMA.- Per...
A trend state indicator, this is a signal modification of the Xbar Clear Close indicator.It has one input parameter:Period- Indicator calculation period.The indicator displays colo...
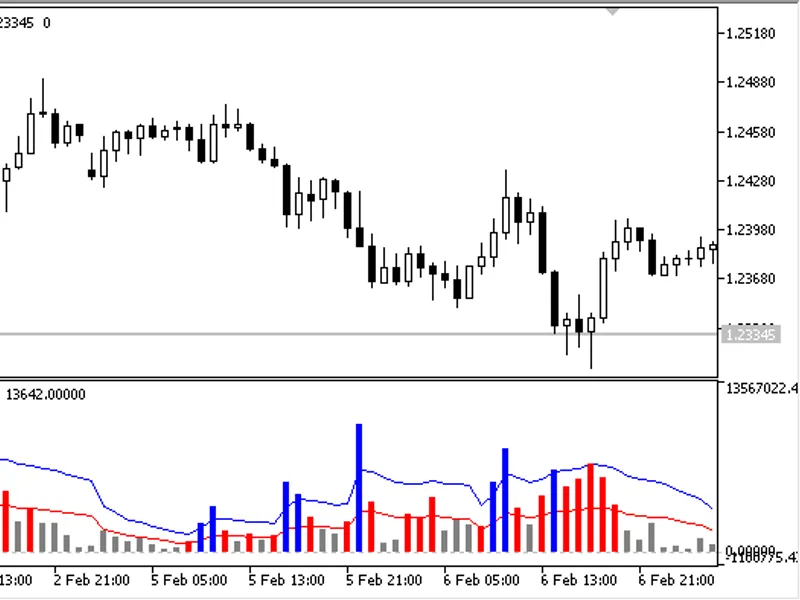
A powerful indicator that displays a signal histogram in a separate window, providing valuable insights for trading decisions.The indicator offers a visual representation of buying...
The indicator displays a stochastic on the price chart, with overbought and oversold zones.It offers eight customizable parameters:- %K Period: Determines the main line calculation...
This indicator offers multi-timeframe functionality, supporting all timeframes available on MetaTrader 5, including three special timeframes:Next Higher Timeframe: The first higher...
This indicator offers multi-timeframe functionality, supporting all timeframes available on MetaTrader 5, along with three unique timeframes:- Next Higher Timeframe: The first high...
Timeframes supported are all the possible timeframes supported by MetaTrader 5, including three special timeframes:Next higher timeframe: The first higher timeframe compared to the...
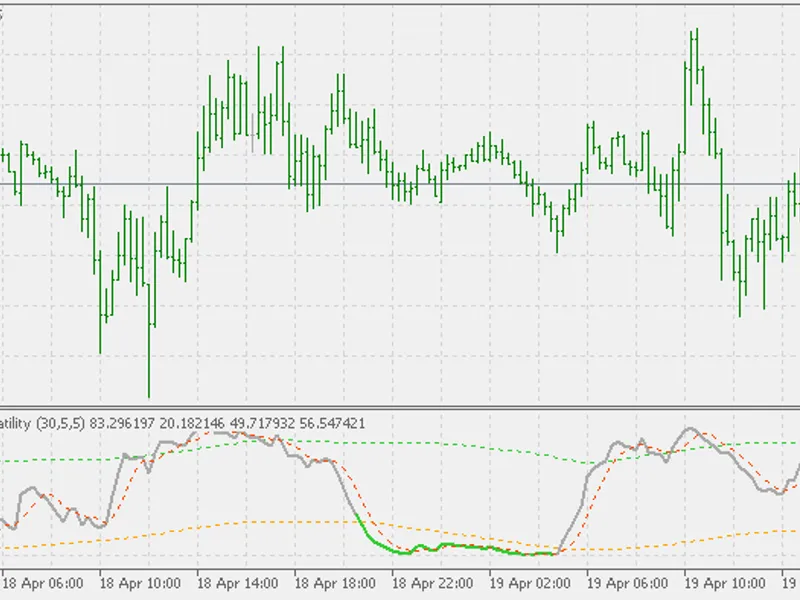
This indicator is based on the original work and concept of stochastic volatility introduced by Francesco G. Cavasino in his published article in 2026.Original Stochastic (original...
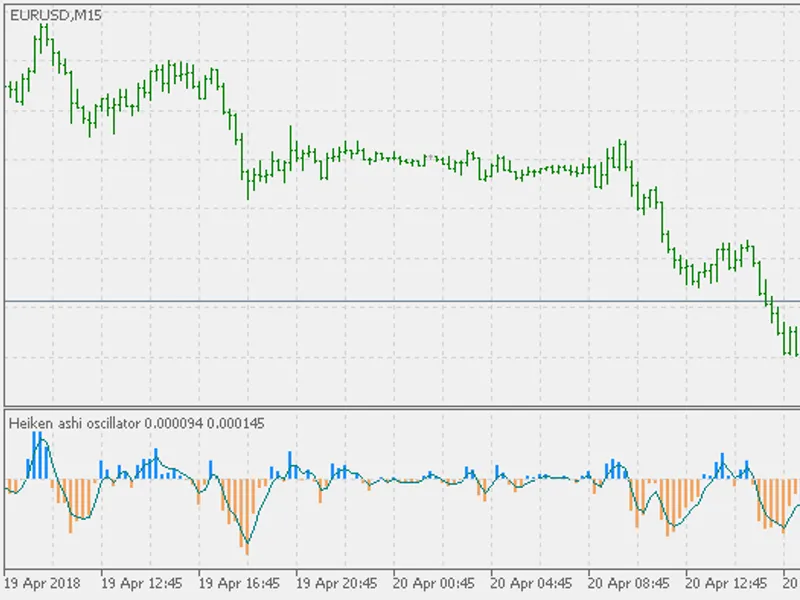
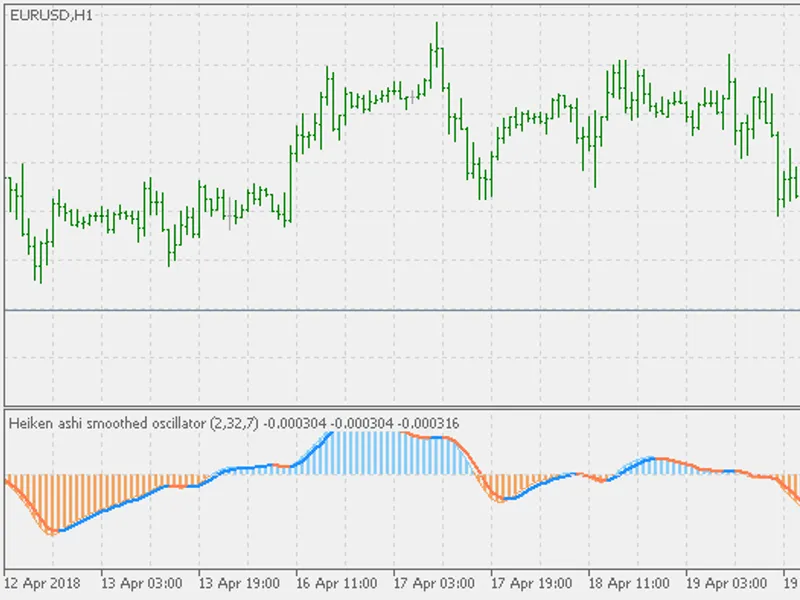
This indicator belongs to the price oscillators family. It uses Heiken Ashi values instead of pure price to determine the trend and its strength. An additional signal line serves t...
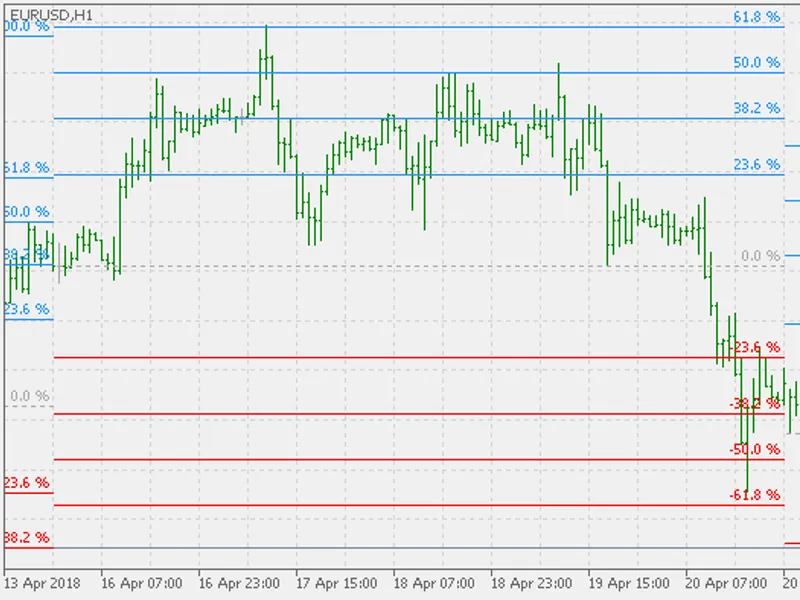
This indicator calculates Fibonacci levels based on the current week's open and the previous week's range.It is particularly useful for long-term traders, providing insights into p...