MA Difference
This software component for MetaTrader 5 is built to enhance the capabilities of your trading environment. This technical indicator acts as a specialized analysis tool designed to visualize market data. It helps traders identify emerging trends, momentum shifts, and key support or resistance levels by plotting statistical calculations directly onto price charts.
How to Setup and Use MA Difference
1. Installation: Place your file in the MQL/Indicators folder via "Open Data Folder" and restart your terminal.
2. Loading: Find the indicator in the Navigator, drag it onto your chart, and configure the input parameters in the popup window.
3. Customization: Press Ctrl+I to open the indicator list, select your tool, and click "Properties" to change colors, levels, or visual styles.
4. Updating: Replace the old file in the Indicators folder with the new version and restart the platform to apply changes.
Frequently Asked Questions
Q: Why is my indicator not showing? A: Verify the file is in the MQL/Indicators folder, or try right-clicking the "Indicators" tree in the Navigator and clicking "Refresh."
Q: Do custom indicators slow down the platform? A: Too many complex indicators can impact performance; remove unused ones via the "Indicator List" (Ctrl+I).
Q: Can I use MT4 indicators on MT5? A: No, MQL4 and MQL5 are distinct languages; ensure the indicator is compiled specifically for your platform version.
Description & Settings
The MA_Difference trend indicator displays the absolute difference between:
the price and the MA1
the price and the MA2
MA1 and MA2
The indicator has nine input parameters:
MA1 period
- MA1 calculation period;
MA1 method
- MA1 calculation method;
MA2 period
- MA2 calculation period;
MA2 method
- MA2 calculation method;
Applied price
- price used for the calculation of two MAs;
Absolute difference
- display the difference as an absolute value (Yes/No);
Show difference MA1/MA2
- whether to display the Difference line (Yes/No);
Show MA1
- whether to display the MA1 line (Yes/No);
Show MA2
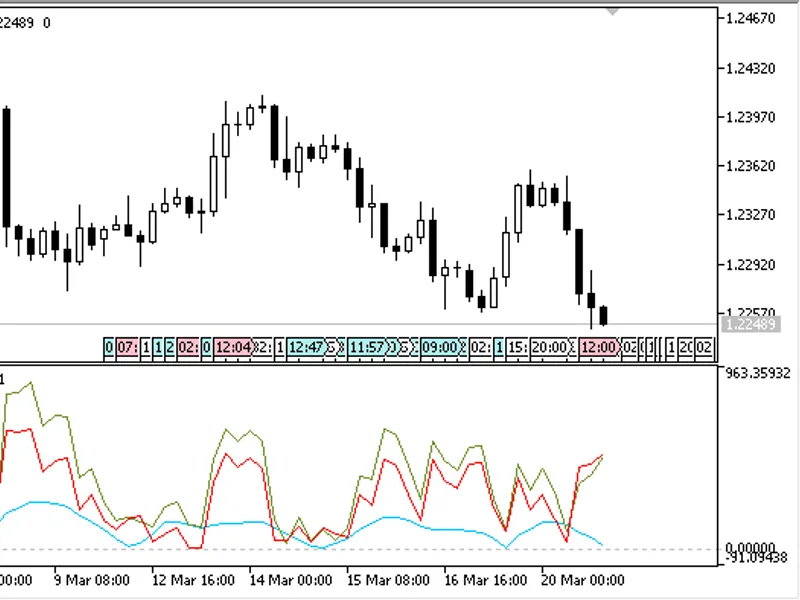
- whether to display the MA2 line (Yes/No). Indicator values can be interpreted similar to the standard ADX: high values of MA1 and MA2 point to the presence of a trend, low values indicate consolidation. The Difference line can be used as a threshold for determining high values of MA1 and MA2.
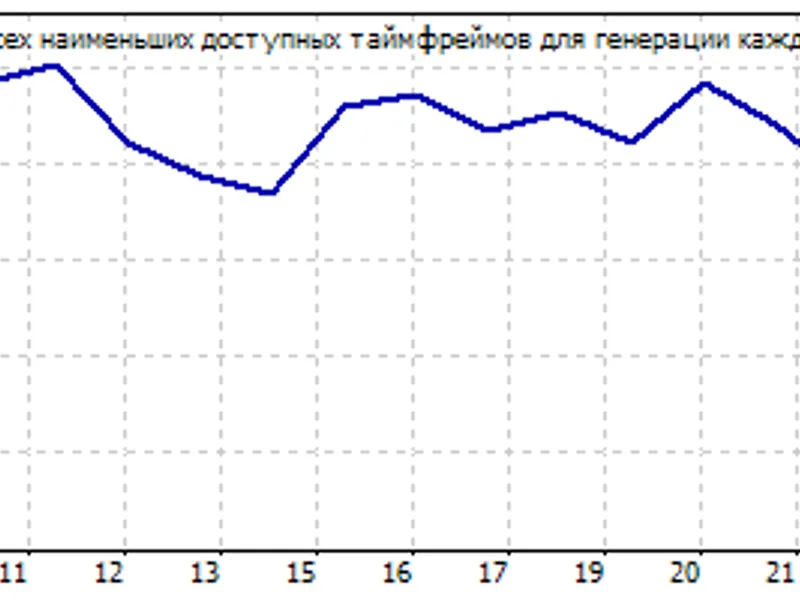
Fig.1. The difference in absolute values
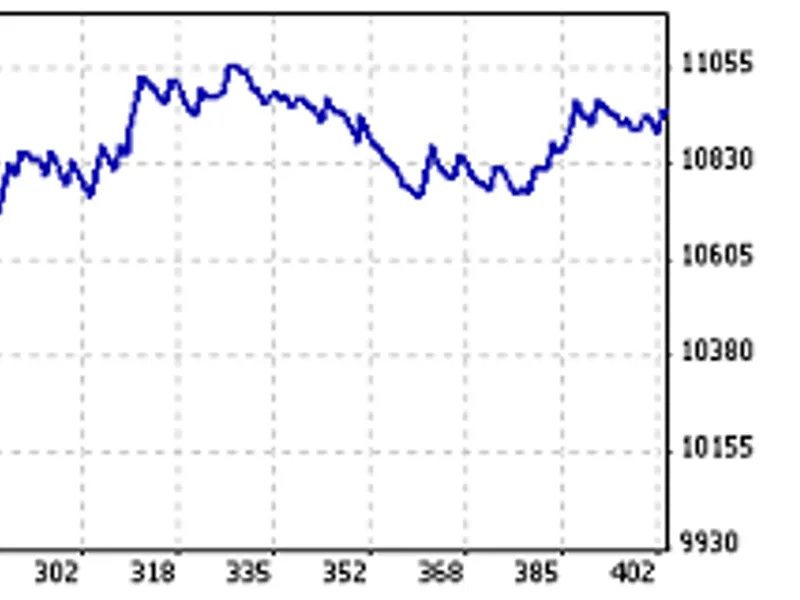
Fig.2. The difference in relative values