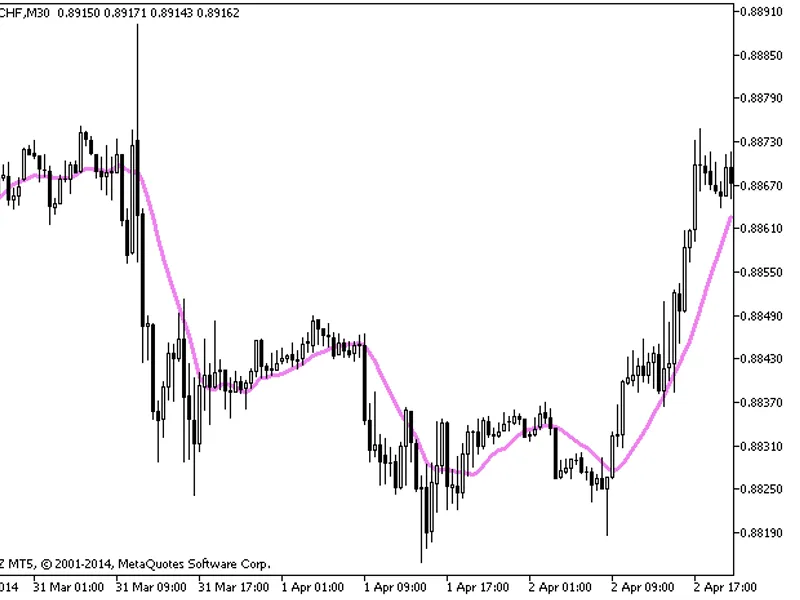
The Awesome Oscillator is an indicator available in MetaTrader 5, offering a versatile tool for traders. It provides four types of averages for calculation:- Simple Moving Average ...
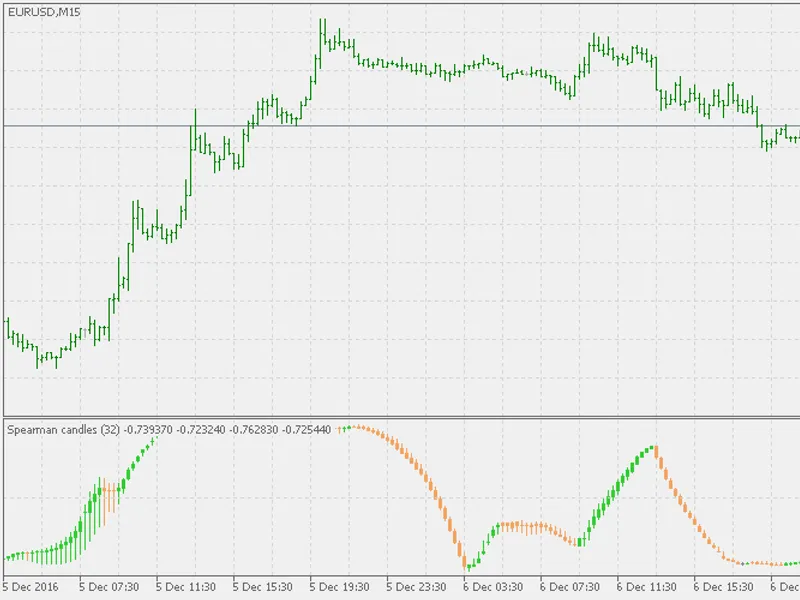
This indicator combines rank (auto)correlation of four prices into a single indicator.Instead of using just one price, this indicator utilizes the standard four prices: open, close...
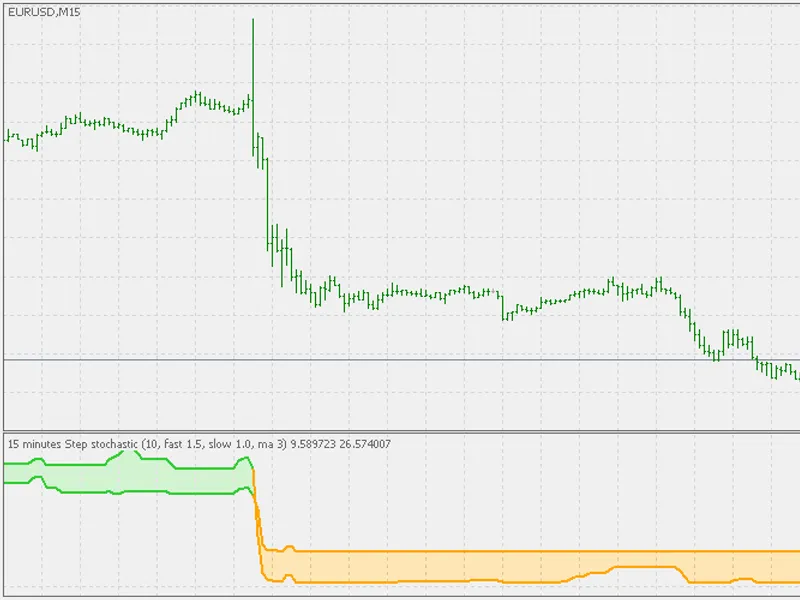
This indicator has been enhanced with several new features and improvements:- The code has been completely rewritten and optimized for better performance.- The step stochastic calc...
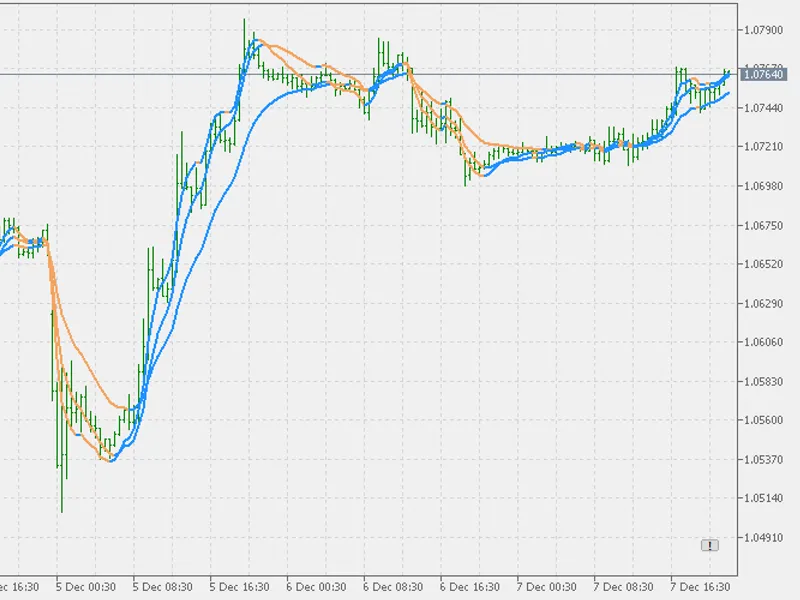
This indicator provides a comprehensive trend analysis by merging two adaptive Laguerre values into a single visual representation.It offers a unique perspective on market trends, ...
The Repulse indicator is a versatile tool for traders, offering dynamic levels and responsive alerts. In essence, the Repulse indicator is designed to:- Color-code price action bas...
This indicator offers a 'smoothing' coefficient ranging from 0 to infinity, providing flexibility in data filtering.Additional features include a selection of 22 price types and mu...
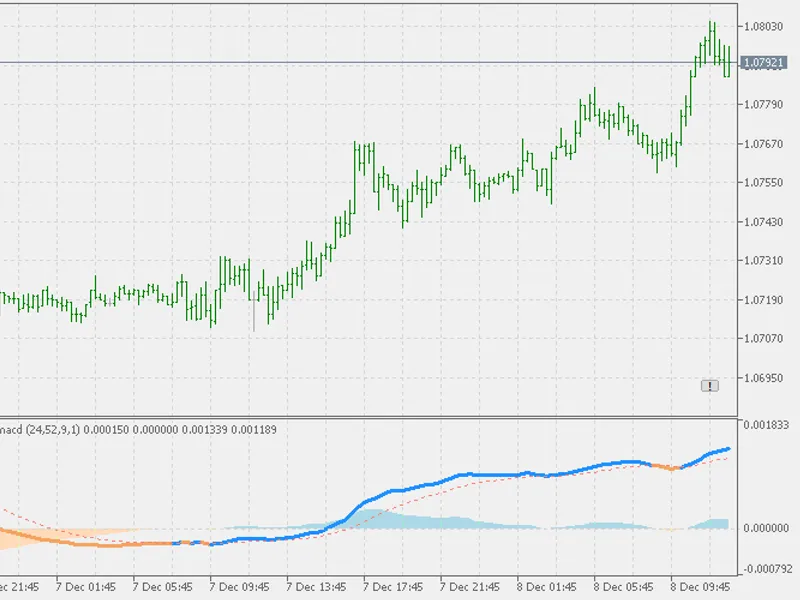
NEMA MACD Indicator — Calculates the MACD using the NEMA.The indicator calculates the MACD using the NEMA. The depth of the NEMA calculation can be set, which determines the type o...
nema indicator - calculates the depth (offspring) of the EMA with an arbitrary 'depth' parameter.When the depth is set to 1, nema is equivalent to ema. For depth 2, it equals dema,...
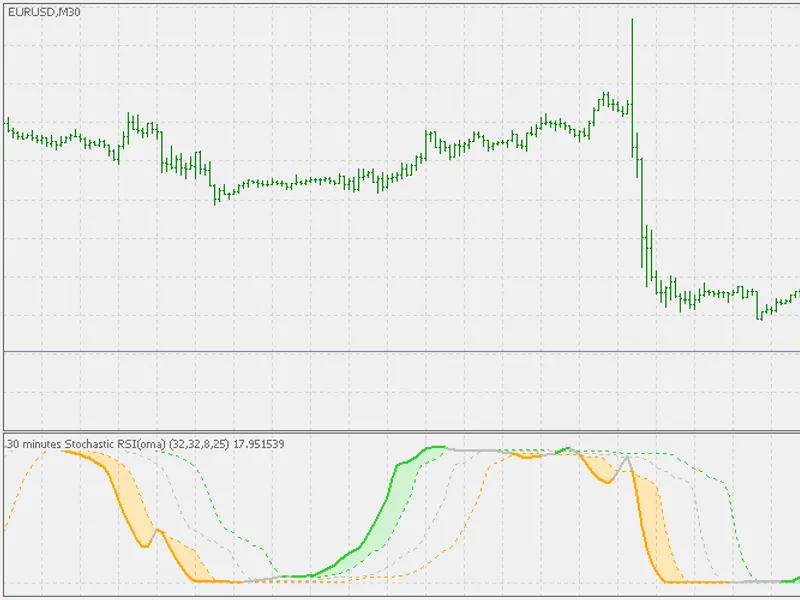
A variation of the Double Smoothed Stochastic indicator with a unique calculation approach.This indicator employs a two-step smoothing process, unlike the original Double Smoothed ...
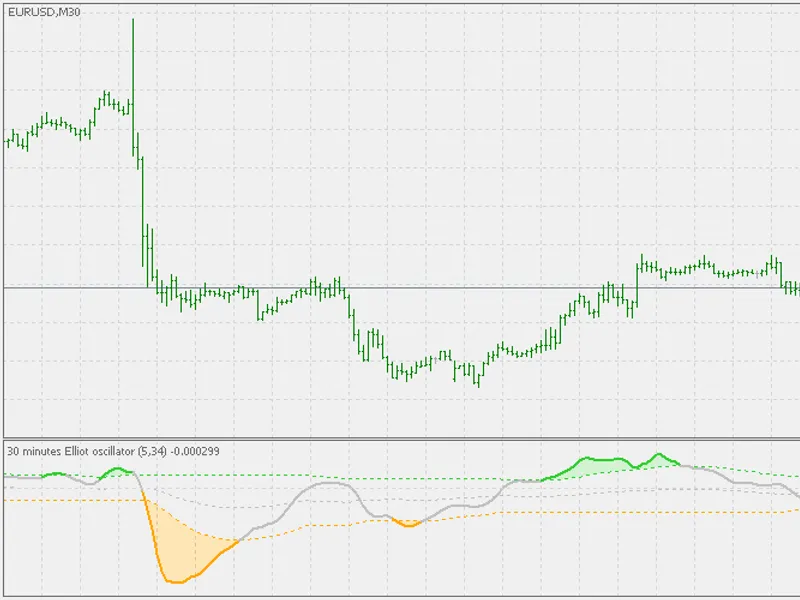
This indicator offers a versatile Elliot Oscillator with various moving average types and customizable color alerts.Moving Average Types:- Simple Moving Average (default)- Exponent...
In short, this is a weighted average or digital filter that calculates coefficients and averages using a probability density function (PDF).The indicator offers a standard set of o...
As the inventor/developer describes it in their article, 'Balance of Market Power':This indicator is a powerful tool for traders, offering a unique perspective on market dynamics. ...
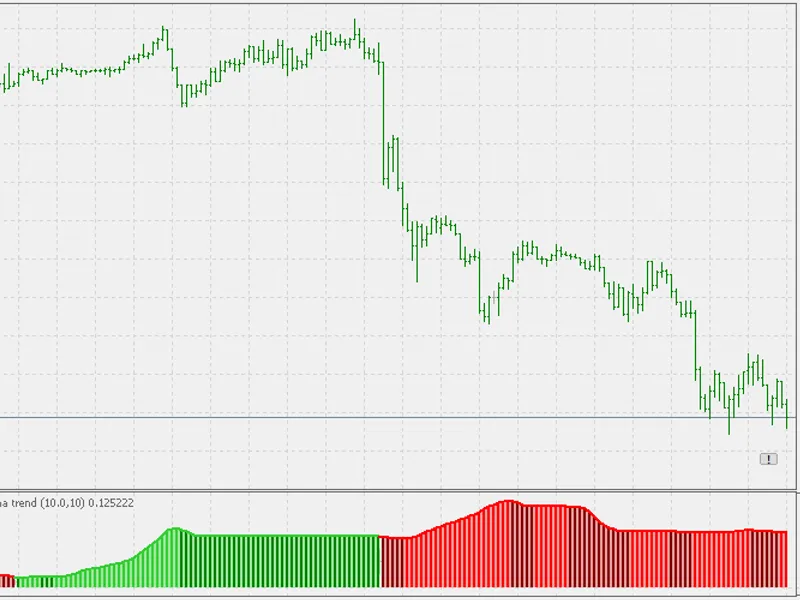
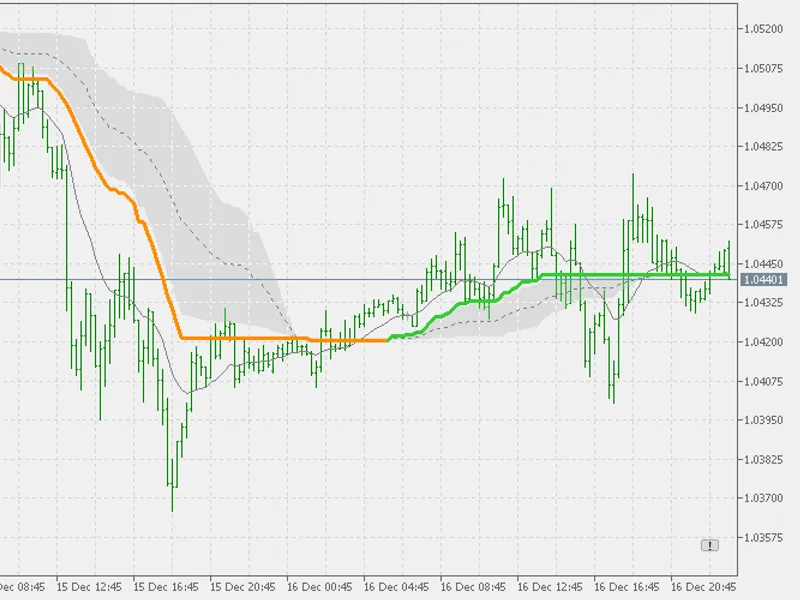
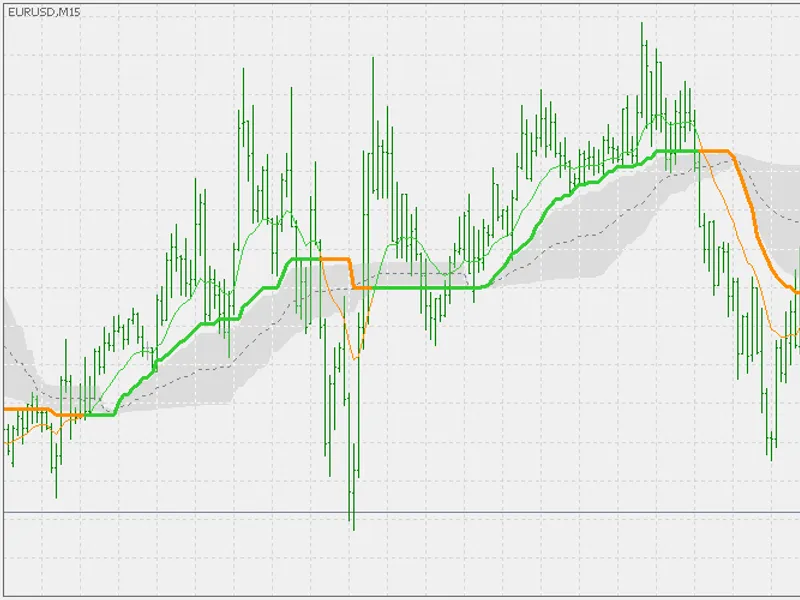
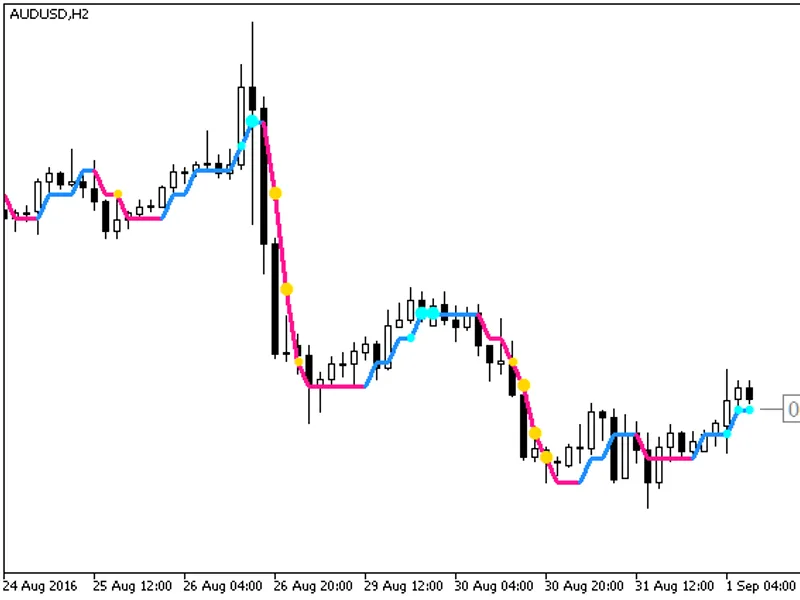
ADXVMA Trend is an indicator that displays the trend using ADXVMA steps.This indicator is based on values similar to ADX, which gives it its name, but with distinct calculations th...
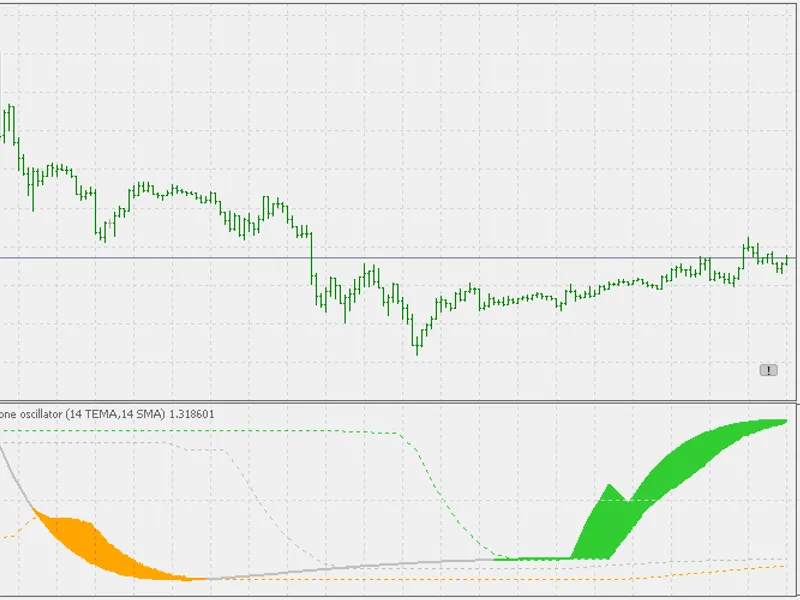
The original was described in the May 2026 issue of TASC. The article introduced a new indicator, the Sentiment Zone Oscillator, which is based on the following moving averages:- S...
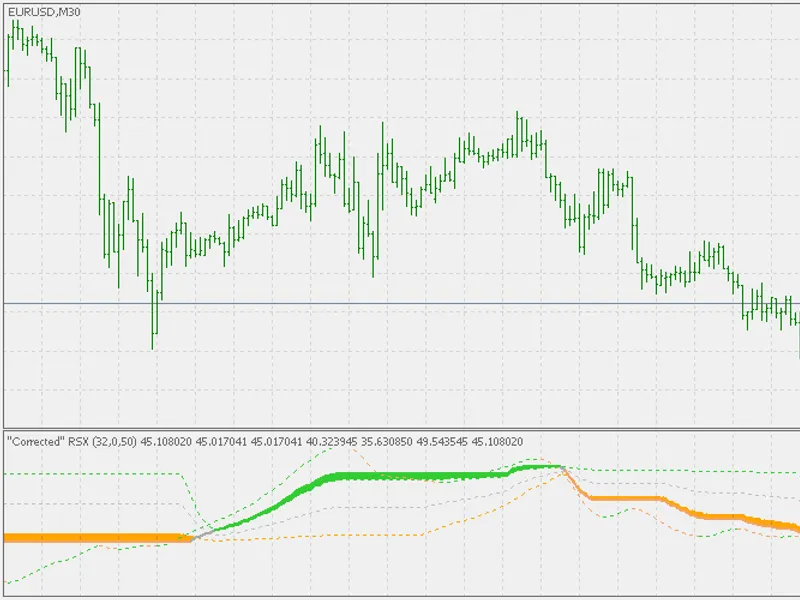
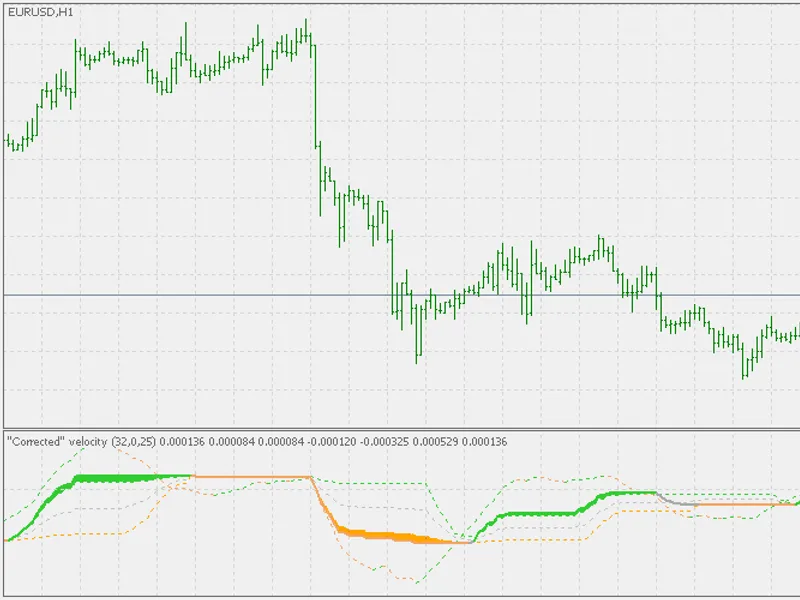
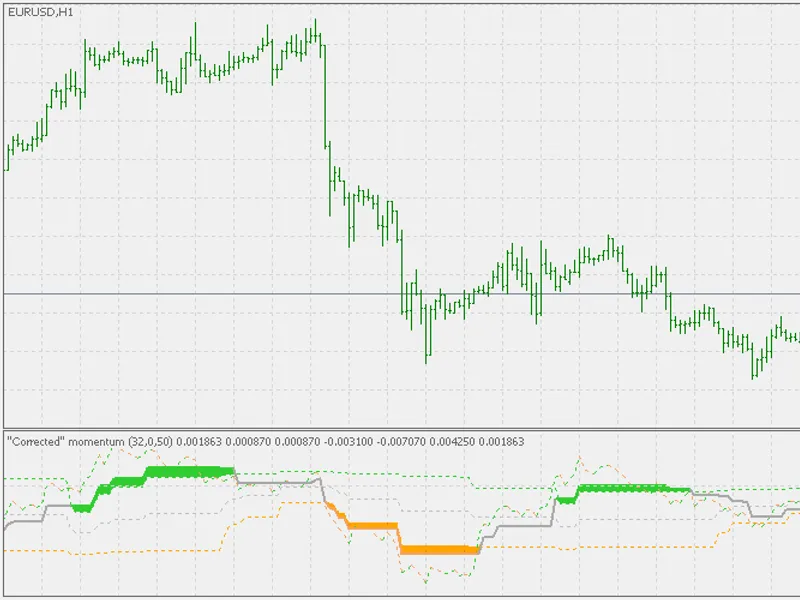
The "correcting" process involves evaluating the significance of changes in the average value by comparing it to a standard deviation. If the change is deemed insignificant, it is ...
RSI (OMA) indicator that displays automatic Fibonacci levels for RSI.If the price smoothing period is greater than 1, the indicator calculates one of the chosen RSI (OMA) values. I...
This indicator provides a comprehensive analysis tool for traders by incorporating a 'click target' feature and a trend line.Features:- Displays the number of bars between the targ...
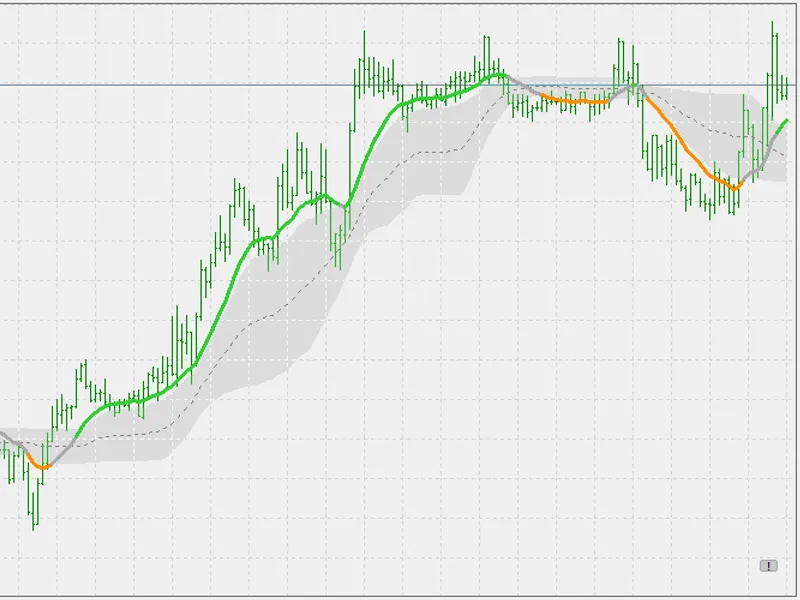
This indicator calculates four basic types of averages with an option for a 'corrected' value.Dr. Uhl's method, while appearing as an adaptive EMA, corrects values in a way that ma...
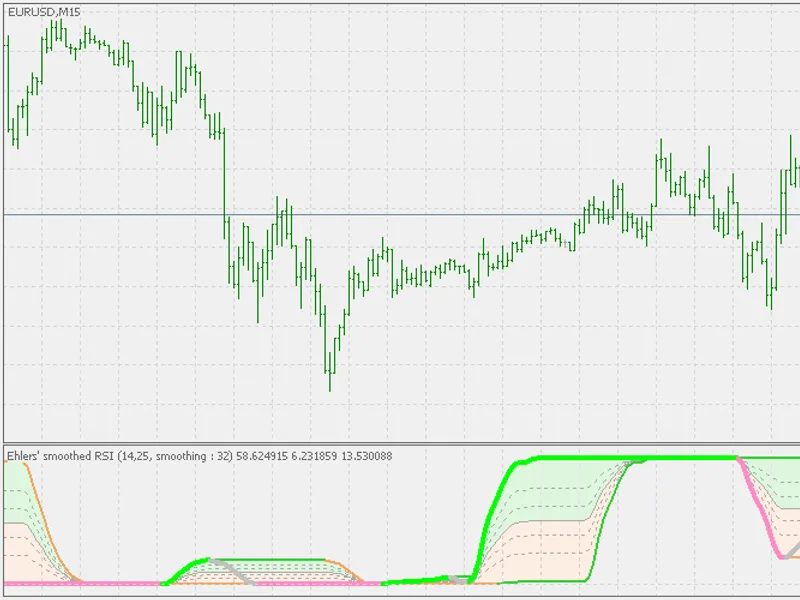
This is the "corrected" version of RSI, offering calculations for the standard 7 types of RSI:- Cuttler's RSI- Ehlers' Smoothed RSI- Harris' RSI- Rapid RSI- RSI - RSX- Slow RSIThe ...
This indicator offers a 'step' or 'corrected' MACD, applying the same correction method used in averages.The 'corrected' values can serve as effective filters, but should not be co...
This indicator is similar to Bollinger Bands, but it utilizes Volume Weighted Average Price (VWAP) as the central value for the bands.You can choose to use either tick volume or re...
A refined velocity indicator with enhanced signal filtering capabilities.When the correction period is set to a negative value, the indicator behaves like a standard velocity indic...
This indicator provides a corrected version of the traditional momentum indicator, offering a more refined approach to analyzing price trends and generating trading signals.By intr...
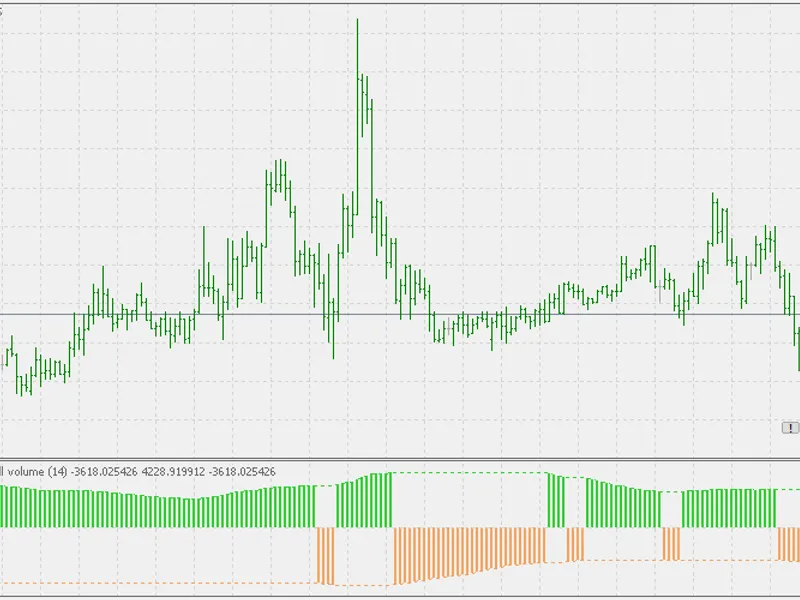
This indicator displays volume based on a price-to-average correlation.The indicator assumes a 'buy' trend state when the price is greater than the corresponding average, using the...
This indicator is similar to the standard MACD, but with normalized values, ensuring a consistent range of values across different instruments and timeframes.The normalization proc...
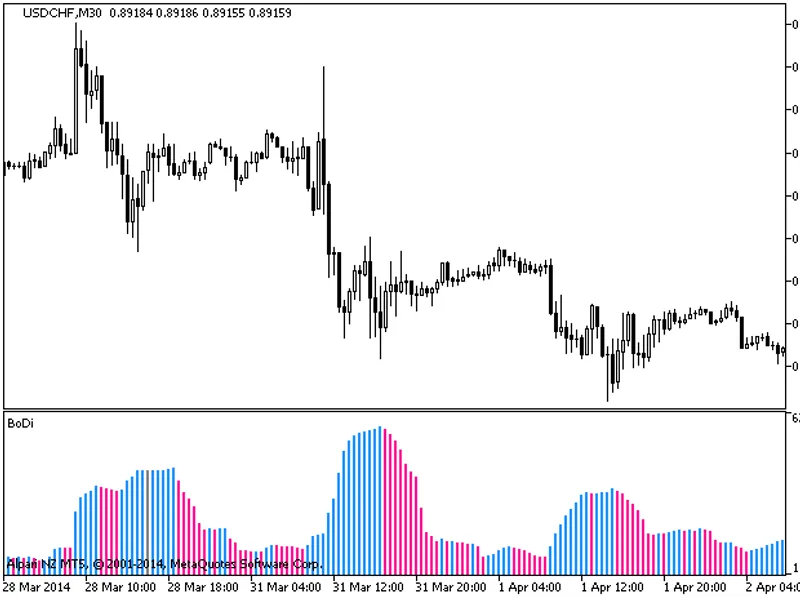
Real Paladin80The principles, calculation formula, interpretation, and algorithm for this indicator are described in the Forex Magazine.The Bo Di indicator is derived from the diff...
A simple trend indicator that calculates the rise and fall in close prices.Calculation formula:i4_drf_v2 = 100 * (psum - nsum) / periodWhere:- psum is the number of candles per cal...
This indicator provides a real-time feed of all deals executed on a symbol, with a visual representation of the total number of deals.The deals are color-coded: red for sell and bl...
Semaphore signal indicator based on the code of the indicator.This indicator utilizes the classes of smoothalgorithms.mqh library, which should be copied to \mql5\include. The use ...
Semaphore signal indicator based on the code of the indicator.The indicator utilizes the classes of the smoothalgorithms.mqh library (copy it to \mql5\include). The application of ...
The indicator with the ability to replace averaging. It displays the most recent value as a price label, with the option to round channel levels to a specified number of digits. Th...
The indicator with the timeframe selection option available in input parameters.The indicator requires i4_drf_v2.mq5 indicator file. Place it in <terminal_data_folder>\mql5\i...
The indicator offers a timeframe selection option within its input parameters.Note: The indicator requires the i4_drf_v3.mq5 indicator file. Please ensure it is placed in the corre...
The indicator with the ability to replace averaging. It displays the most recent value as a price label, rounding channel levels to a specified number of digits. It also indicates ...
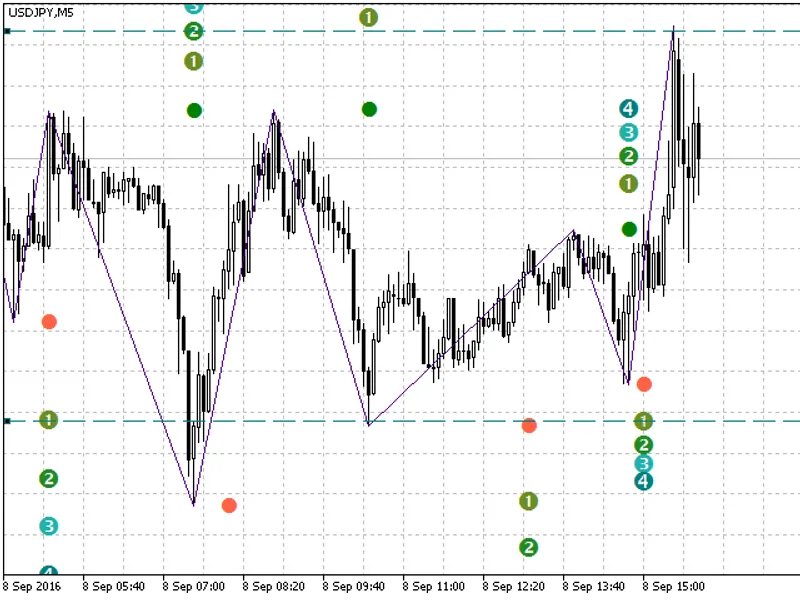
The Fibo Zig Zag indicator calculates probable support and resistance levels using Fibonacci ratios.The indicator algorithm identifies key price points and applies Fibonacci retrac...
The indicator draws Fibonacci levels based on the last bar. When a new bar appears, the levels are automatically redrawn.Parameters:- Last Bar for Fibo: Select the timeframe to con...
The indicator provides a visual representation of the statistical distribution for bid and ask prices, displaying a cumulative diagram.Additionally, it enables the analysis of othe...
The indicator with the ability to replace averaging. It displays the most recent value as a price label, rounding channel levels to the required number of digits. It also indicates...
The indicator with the timeframe selection option in the input parameters.The indicator requires the XVAMA.mq5 indicator file. Place it in <terminal_data_folder>\mql5\indicat...
The indicator offers a timeframe selection feature in its input parameters.Note: The indicator relies on the jsatl.mq5 indicator file, which should be placed in the <terminal_da...
The indicator offers a timeframe selection option in its input parameters.It requires the afl_winnerv2.mq5 indicator file, which should be placed in <terminal_data_folder>\mq...
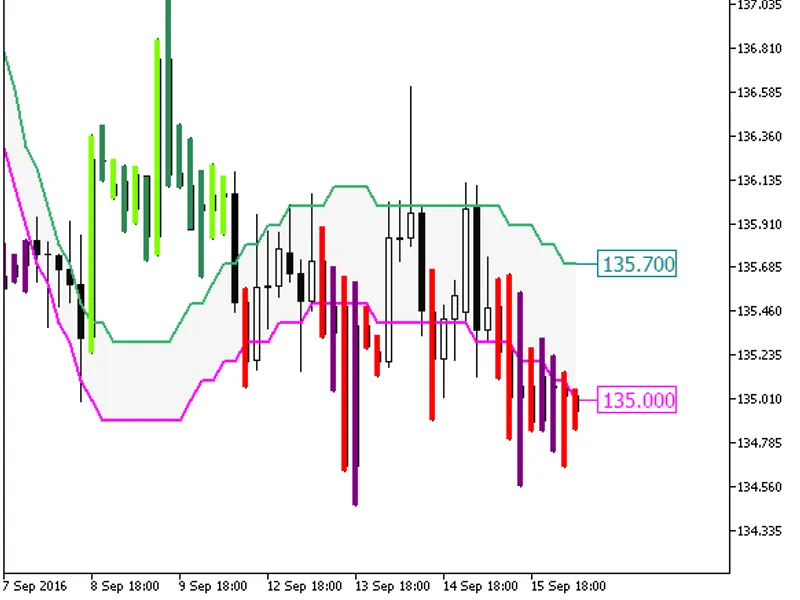
This indicator implements a breakout system using a channel based on the high and low price series processed by the JSATL algorithm.When the price exits the gray channel, the bar c...
Smoothed fast digital filter with color indication of movement direction, displaying the most recent value as a price label with the option to round channel levels to a specified n...
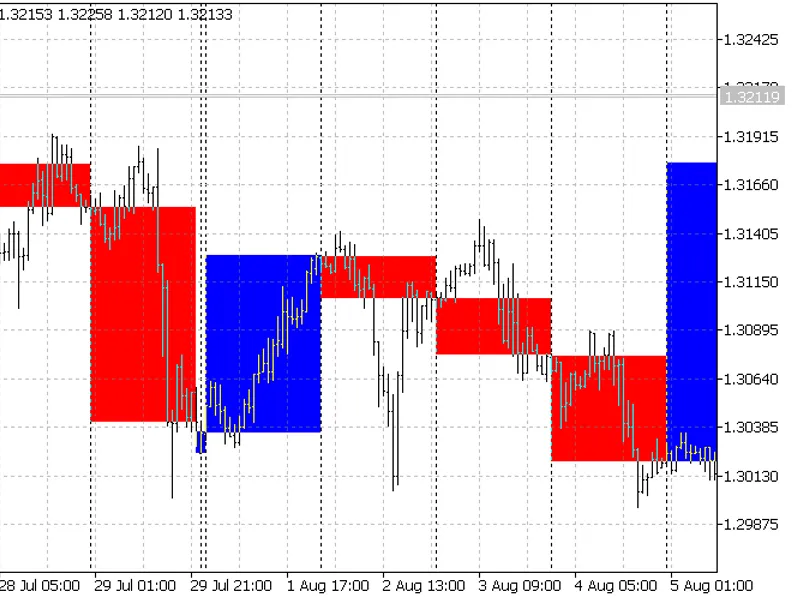
The Color Day Indicator visually distinguishes bullish and bearish days on a chart.It works as follows:- If the daily close is greater than the open, the day is colored blue.- If t...
This indicator combines calculations based on Welles Wilder's formula, presenting the 'fluctuation indicator' and 'cumulative fluctuation index' of the price as a colored histogram...
Waddah AttarThis indicator displays the strength of bulls and bears in a straightforward manner within a single window.It utilizes the smoothalgorithms.mqh library's classes (place...