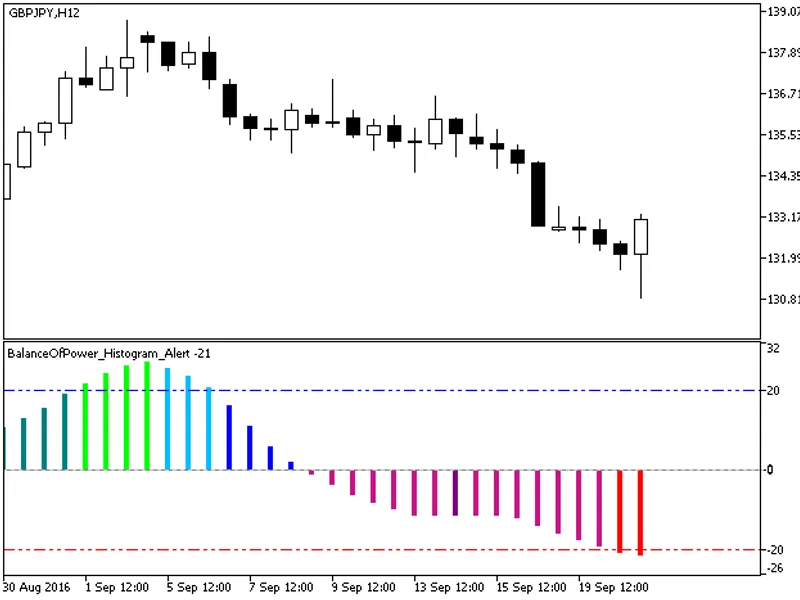
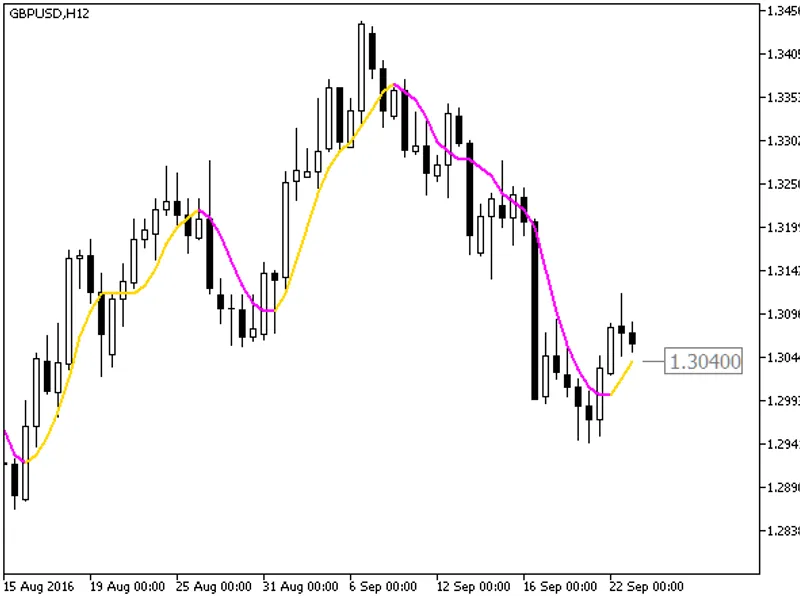
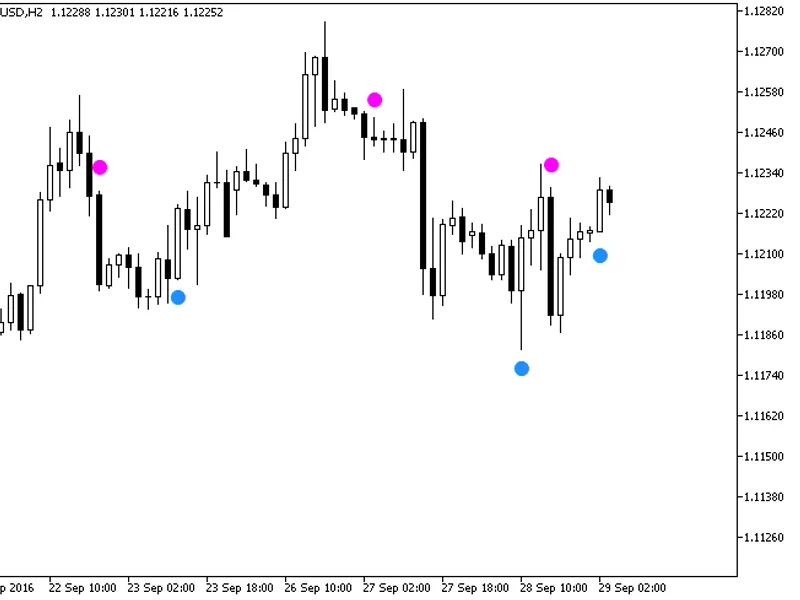
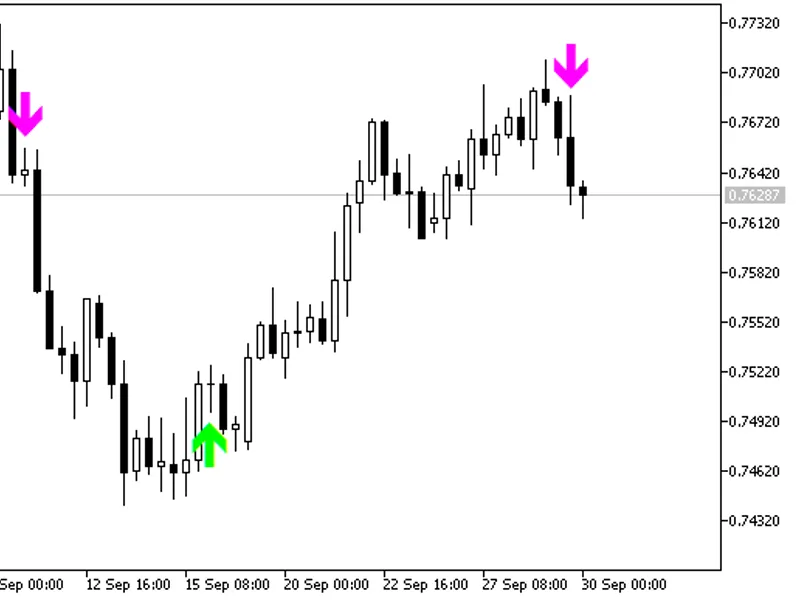
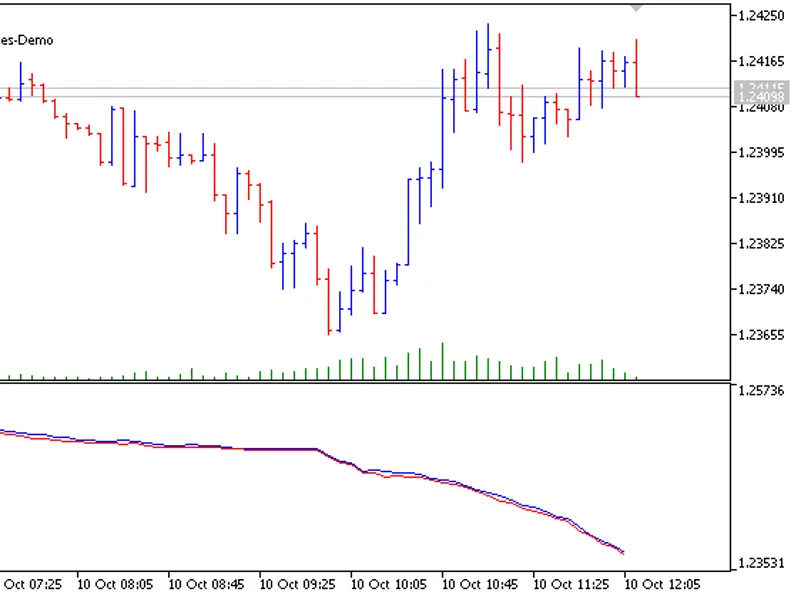
A trend indicator that utilizes the MACD values multiplied by the averaged price of a financial asset, presented as a colored histogram.This indicator employs the SmoothAlgorithms....
The Waddah Attar Trend HTF indicator offers a unique feature: the ability to select the timeframe directly from the input parameters.To use this indicator, you'll need the Waddah_A...
The Bear Bulls Power HTF indicator offers a timeframe selection option in its input parameters.This indicator requires the bear_bulls_power.mq5 indicator file, which should be plac...
the indicator with the timeframe selection option available in input parameters:the indicator requires si_q_asi.mq5 indicator file. place it in <terminal_data_folder>\mql5\in...
The indicator offers a timeframe selection option in its input parameters.It requires the colorjsatl_digit.mq5 indicator file, which should be placed in /mql5/indicators.Fig. 1: Co...
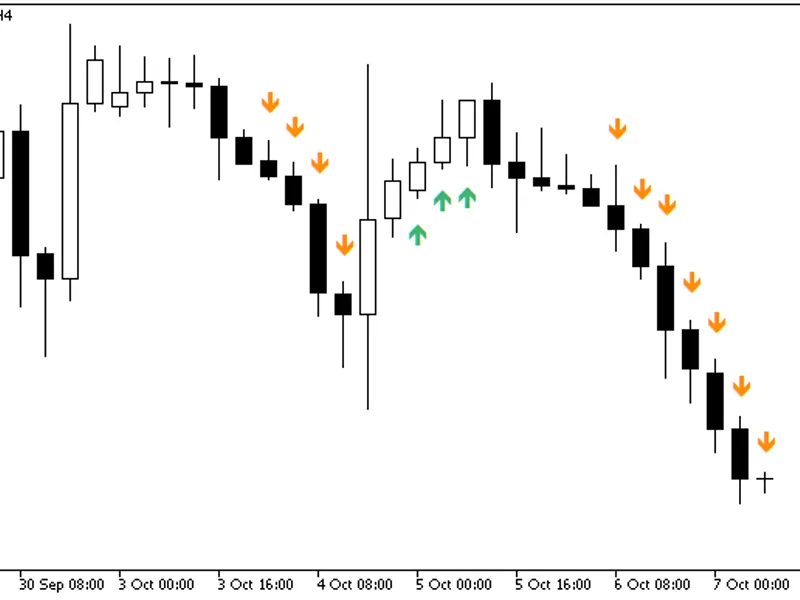
This indicator introduces new input parameters and enhanced functionality with the addition of three new functions: buysignal(), sellsignal(), and getstringtimeframe().The buysigna...
This indicator introduces new input parameters and enhances functionality with three new functions: buysignal(), sellsignal(), and getstringtimeframe().The functions buysignal() an...
The JSATL Candle indicator is a powerful tool for traders, offering a unique perspective on price action. It presents a sequence of candlesticks derived from the JSATL algorithm's ...
The ATR Channels Cloud Digit HTF indicator offers a unique feature: the ability to select the timeframe directly from the input parameters.This indicator requires the atr_channels_...
The indicator offers a timeframe selection feature in its input parameters.Note: The indicator requires the jsatl_digit_system.mq5 indicator file. Please ensure it is placed in the...
The indicator draws candlesticks of a higher timeframe as color-filled rectangles using buffers.Rectangles are color-filled based on the candle color change of the JSATLCandle indi...
The indicator with the timeframe selection option in the input parameters.This indicator requires the floatpivot_digit.mq5 indicator file. Place it in \mql5\indicators.Fig. 1: The ...
This indicator is a simple tool that utilizes a specified period to identify and mark the minimum and maximum values with dots.New input parameters have been introduced, and three ...
This indicator provides a comprehensive view of the market by drawing daily, weekly, and monthly pivots with backtesting capabilities.The Waddah Attar Pivot indicator was initially...
The indicator with the timeframe selection option available in input parameters:The indicator requires xfatlxsatlmacd.mq5 indicator file. Place it in \mql5\indicators.Fig1. The xfa...
MetaQuotes Software Corp.This indicator employs a unique plotting style, enabling the drawing of segments exclusively between points situated on distinct bars. The draw_zigzag draw...
This indicator displays three pivots on a single chart, allowing you to visualize and analyze multiple timeframes simultaneously.The Waddah Attar Pivot indicator is a powerful tool...
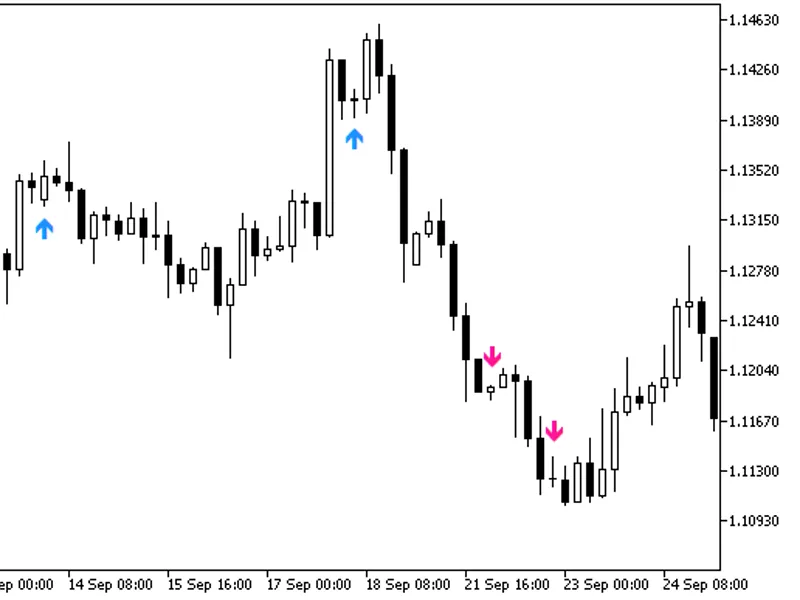
This indicator introduces new input parameters and additional functionality to enhance trading signals.Three new functions have been added to the indicator code: buysignal(), sells...
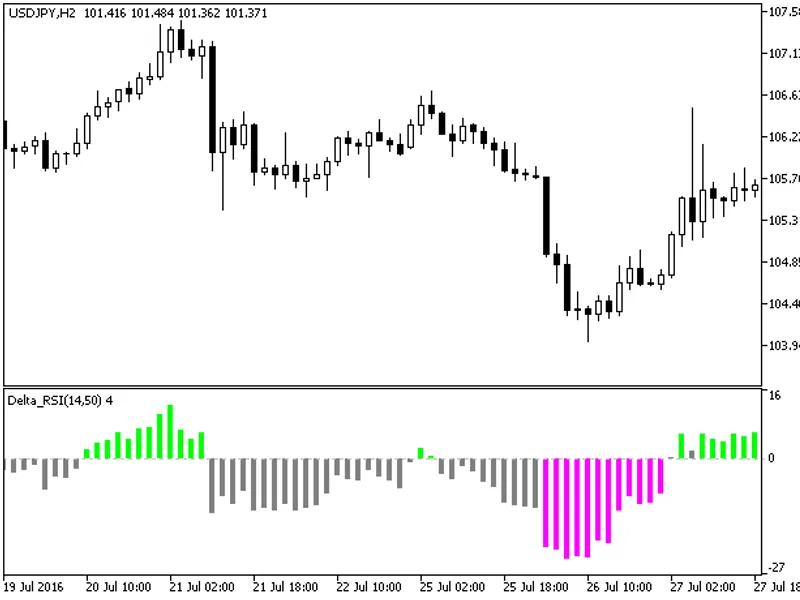
TorThis indicator is a trend analyzer based on the difference between two RSI oscillators with varying periods.It is a valuable tool for traders who analyze two RSI indicators with...
Introduced new input parameters.Added three new functions to the end of the indicator code: BuySignal(), SellSignal(), and GetStringTimeframe().Added calls to BuySignal() and SellS...
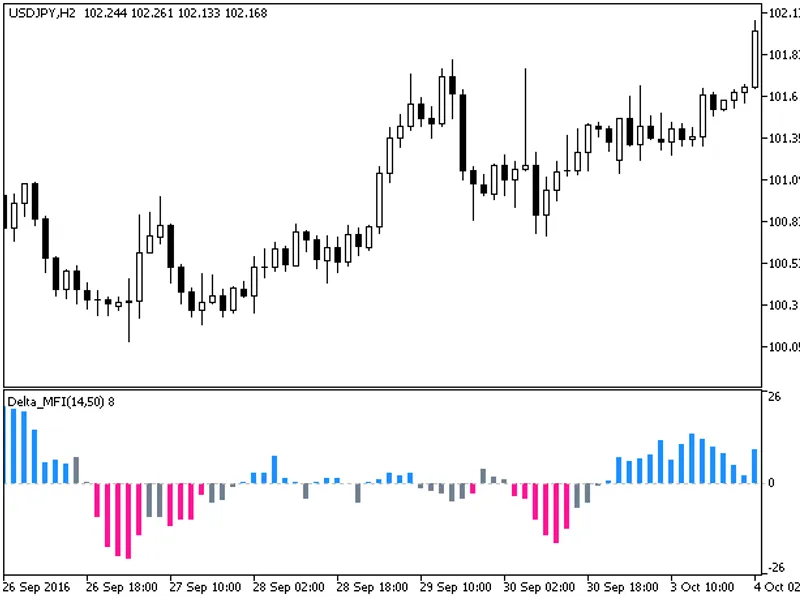
TorThis trend analyzer is based on the difference between two MFI oscillators with varying periods.The indicator is designed to assist traders who analyze two MFI indicators with d...
The indicator with the timeframe selection option in the input parameters.This indicator requires the delta_rsi.mq5 indicator file. Place it in <terminal_data_folder>\mql5\in...
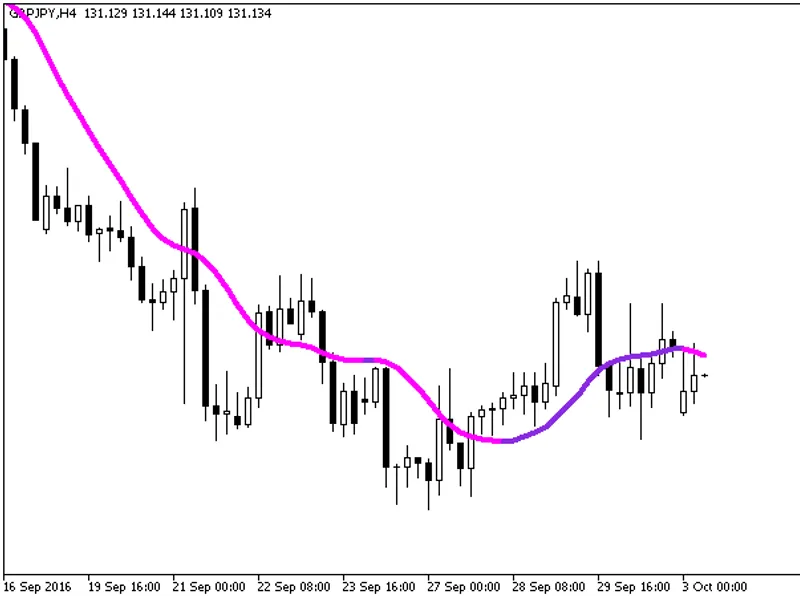
This indicator calculates the moving average for prices using the formula: (open+close+high+low)/4.Indicator Settings:- yma_period: The period for the moving average....
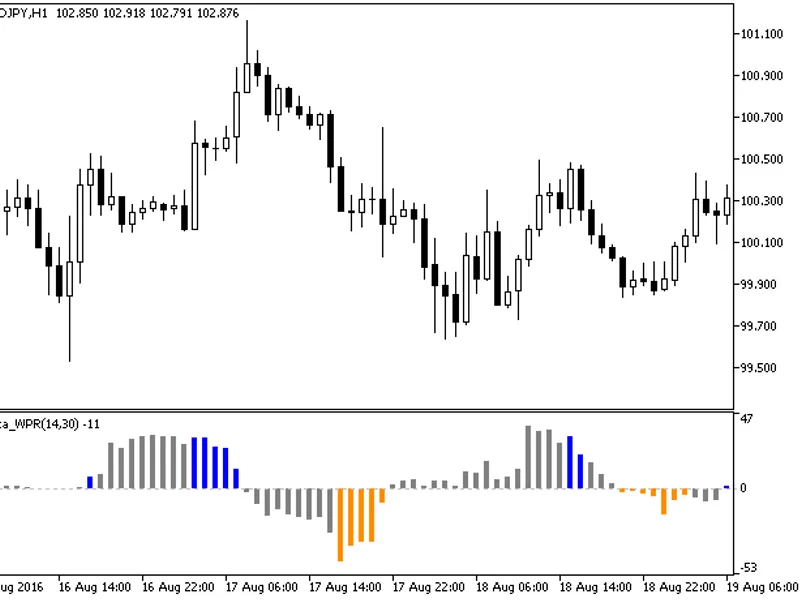
TorThis trend analyzer is based on the difference between two WPR oscillators with distinct periods.The indicator is beneficial for users who analyze two WPR indicators with differ...
The indicator with the timeframe selection option available in input parameters.The indicator requires the Delta_MFI.mq5 indicator file. Place it in <terminal_data_folder>\mq...
This indicator calculates the geometric moving average based on the average (open, high, low, close) prices over a specified period.Indicator Settings:- gma_period: Set the period ...
This indicator calculates and displays the difference between the arithmetic mean and geometric mean of the price.The price is determined using the formula: (O+H+L+C)/4, where O re...
This indicator calculates and displays the difference between the estimated values of the current and previous bars.The estimated value is derived from the difference between the a...
The indicator with the timeframe selection option in the input parameters.This indicator requires the delta_wpr.mq5 indicator file. Place it in <terminal_data_folder>\mql5\in...
The RSI Slowdown indicator is designed to identify price reversals by detecting a decrease in the rate of change of the RSI indicator and its subsequent reversal.It operates by loc...
The MFI Slowdown indicator is designed to identify potential price reversals by monitoring the Money Flow Index (MFI) for signs of stagnation or reversal.This indicator operates on...
The WPR Slowdown indicator is a powerful tool designed to identify potential price reversals by analyzing the rate of change of the Williams Percent Range (WPR) indicator.It operat...
A custom indicator that combines the Zig Zag pattern with the Commodity Channel Index (CCI) oscillator.This indicator is designed to identify and highlight the Zig Zag pattern on t...
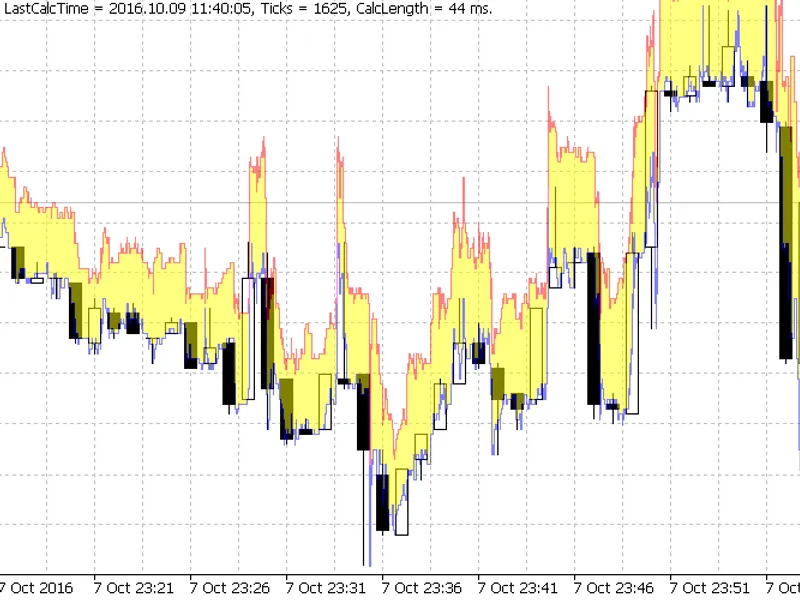
This tick indicator displays tick history directly on the main chart over the bars, providing a clear view of the 'spread' history and the formation of each bar. It visually repres...
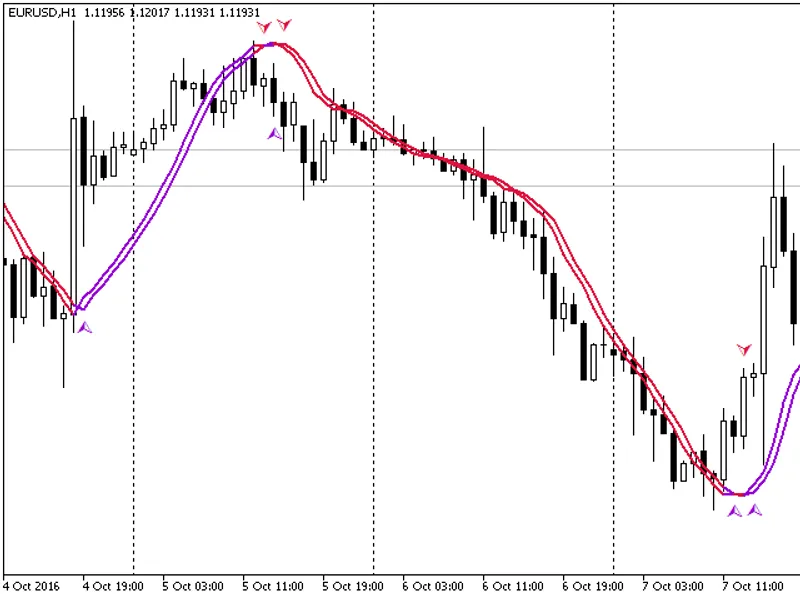
This is a comprehensive indicator named 'Trigger Line with Arrow'. It offers traders a reliable tool within the MetaTrader platform. Adhering to the standard MT4/MT5 conventions, t...
This indicator displays the ask and bid prices, sourced from the real tick history. It enables the visual comparison of ask and bid values, facilitating the analysis of spread chan...
A Zig Zag indicator based on the DeMarker oscillator.This indicator is a visual tool that helps traders identify significant price movements and potential reversal points.The Zig Z...
The Zig Zag indicator based on the iForce oscillator.The Zig Zag iForce indicator is a powerful tool for traders, offering a unique perspective on market trends and potential rever...
This indicator displays arithmetic and geometric moving averages in a single window, calculated using the average of open, close, high, and low prices.Indicator Settings:- yma_peri...
The indicator calculates the difference between the arithmetic and geometric moving averages using the average price (open + close + high + low)/4.Indicator Settings:- yma_period: ...
Derivative of the difference between the arithmetic and geometric moving averages calculated using (open + close + high + low)/4 prices.Indicator Settings:- yma_period — Period for...
The Kijun-Sen indicator is a powerful tool derived from the Ichimoku indicator, offering a unique perspective on market trends. It calculates the mean of the high and low prices ov...
This indicator is designed to enhance trading strategies with a unique combination of features.It includes a set of alerts and multi-timeframe analysis, building upon the capabilit...
This indicator combines the functionality of the BB Stops indicator with the Stochastic Oscillator.It includes a set of alerts and multi-timeframe analysis.The BB Stops indicator i...