Rsi(oma) with auto Fibonacci levels
This tool for MetaTrader 5 is specifically engineered to streamline your trading operations. This technical indicator acts as a specialized analysis tool designed to visualize market data. It helps traders identify emerging trends, momentum shifts, and key support or resistance levels by plotting statistical calculations directly onto price charts.
How to Setup and Use Rsi(oma) with auto Fibonacci levels
1. Installation: Place your file in the MQL/Indicators folder via "Open Data Folder" and restart your terminal.
2. Loading: Find the indicator in the Navigator, drag it onto your chart, and configure the input parameters in the popup window.
3. Customization: Press Ctrl+I to open the indicator list, select your tool, and click "Properties" to change colors, levels, or visual styles.
4. Updating: Replace the old file in the Indicators folder with the new version and restart the platform to apply changes.
Frequently Asked Questions
Q: Why is my indicator not showing? A: Verify the file is in the MQL/Indicators folder, or try right-clicking the "Indicators" tree in the Navigator and clicking "Refresh."
Q: Do custom indicators slow down the platform? A: Too many complex indicators can impact performance; remove unused ones via the "Indicator List" (Ctrl+I).
Q: Can I use MT4 indicators on MT5? A: No, MQL4 and MQL5 are distinct languages; ensure the indicator is compiled specifically for your platform version.
Description & Settings
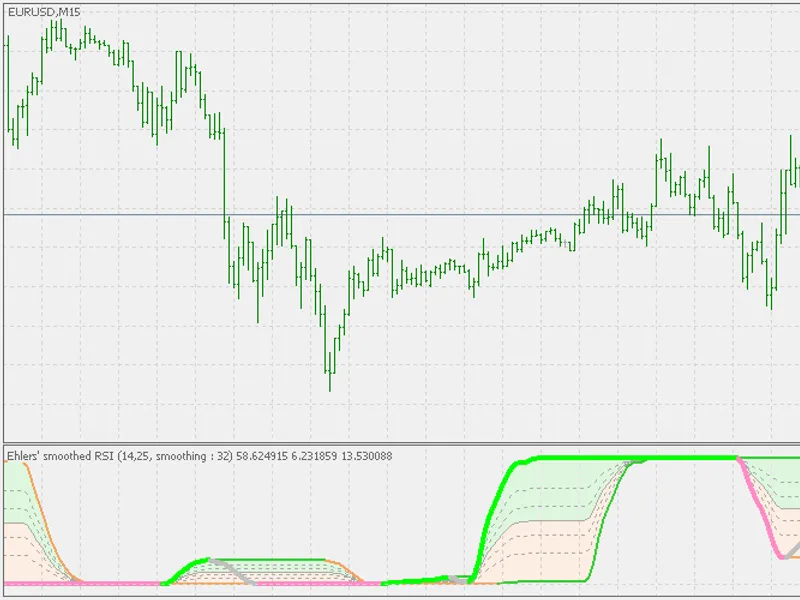
RSI (OMA) that shows automatic Fibonacci levels for RSI.
If the prices smoothing period is set to > 1, then the indicator calculates one of the chosen RSI (OMA) values. If the price smoothing is set to <= 1, then the calculated value is RSI. RSI can be one of the 7 types:
Cuttler's RSI
Ehlers' smoothed RSI
Harris' RSI
Rapid RSI
RSI
RSX
Slow RSI
For any RSI value calculated, the indicator automatically shows the Fibonacci levels, so that the value of rsi can be estimated using those levels.