Corr RS I
This software component for MetaTrader 5 is built to enhance the capabilities of your trading environment. This technical indicator acts as a specialized analysis tool designed to visualize market data. It helps traders identify emerging trends, momentum shifts, and key support or resistance levels by plotting statistical calculations directly onto price charts.
How to Setup and Use Corr RS I
1. Installation: Place your file in the MQL/Indicators folder via "Open Data Folder" and restart your terminal.
2. Loading: Find the indicator in the Navigator, drag it onto your chart, and configure the input parameters in the popup window.
3. Customization: Press Ctrl+I to open the indicator list, select your tool, and click "Properties" to change colors, levels, or visual styles.
4. Updating: Replace the old file in the Indicators folder with the new version and restart the platform to apply changes.
Frequently Asked Questions
Q: Why is my indicator not showing? A: Verify the file is in the MQL/Indicators folder, or try right-clicking the "Indicators" tree in the Navigator and clicking "Refresh."
Q: Do custom indicators slow down the platform? A: Too many complex indicators can impact performance; remove unused ones via the "Indicator List" (Ctrl+I).
Q: Can I use MT4 indicators on MT5? A: No, MQL4 and MQL5 are distinct languages; ensure the indicator is compiled specifically for your platform version.
Description & Settings
Cuttler's RSI
Ehlers' smoothed RSI
Harris' RSI
Rapid RSI
RSI
RSX
Slow RSI
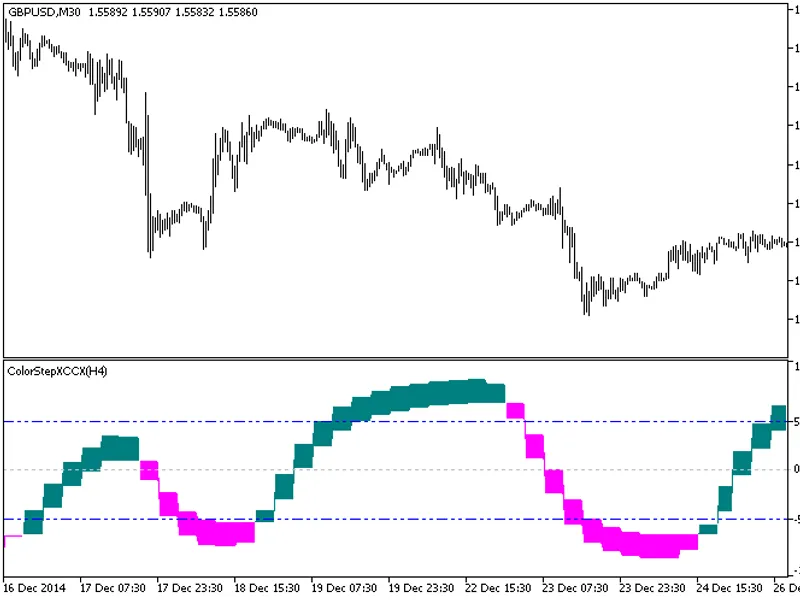
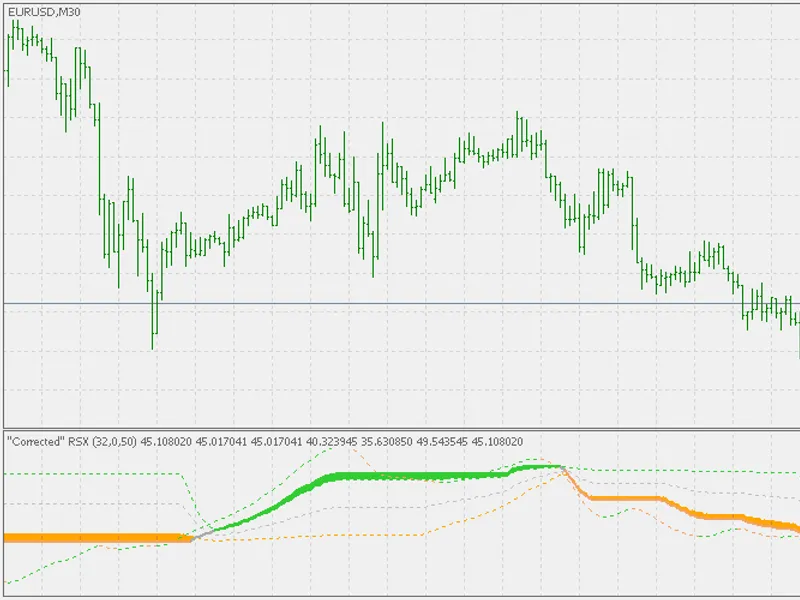
You can turn the "correcting" on or off (using the "correction" period). Also, 4 types of color/trend/state changes are available. It is similar to step rsi but it should not be mixed with it. They are completely different indicators. A usual, you can turn the "correction" on and off and you can chose the criteria for "trend" or over bought / over sold finding out based on:
on slope change
on outer levels cross
on middle level ("fake zero line") cross
or on original rsi value cross (in which case rsi is used as a sort of a signal line)
The usual parameters experimenting is advised. The above example on a larger scale: