This is a variation of a digital filter using Hann windowing for filteringwith "speed up" factor set to 0, it is the same as original filter any speed up factor > 0 makes it a b...
On-balance volume (OBV) is a technical trading momentum indicator that uses volume flow to predict changes in stock price. Joseph Granville first developed the OBV metric in the 19...
As simple as it gets, channels based om high, low and ATR distances, Shows possible short term support / resistance or can be used as tp/sl in some trading systemsRecommendations: ...
This is the indicator originally posted here that is extended with a display of "states"."states" are displayed as colored histogram they can be calculated using :level 3 - outer ...
Based on the Austin Passamonte's idea , this indicator calculates pivots for any time frame (provided that the chosen time frame is higher than the chart time frame).Two modes of c...
Description: Displays the current timeframe and symbol name in large font on the chart background. Useful when hopping between several charts with different symbols at the same tim...
iExposure will show the opening of trading positions in tabular form in the sub-window below the main window. This allows the trader to see at a glance the positions in the market ...
To calculate the average price, you can specify the periods H1 and D1. For example, the D1 average price allows you to track whether the price of a certain financial instrument is ...
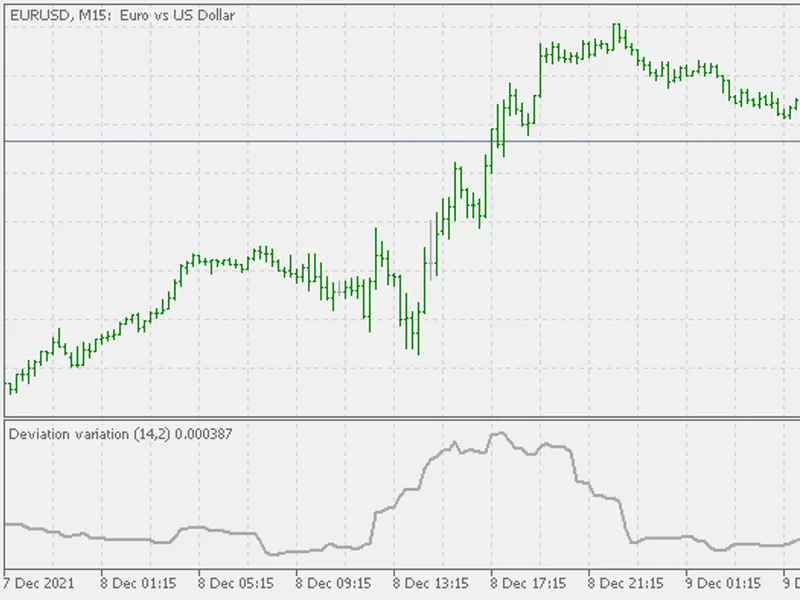
This is a variation on the standard deviationit is using momentum of price (instead price itself) for calculation it is calculated in a way that it takes minimal CPU load As far as...
As a quick example how momentum deviation (published here : ) can be used, this is a momentum deviation bands indicator (similar - but just similar - to Bollinger bands)Recommendat...
ZigZag Color Indicator for Line Charts which works on Close prices rather than High lowThis indicator has only one input parameter which is ExtDepth and its optimized for performan...
In his article in January 2022 issue of TASC, “(Yet Another) Improved RSI,” John Ehlers explains how he enhances the RSI by taking advantage of Hann windowing. The RSIH indicator p...
cycles though market watch symbols, using hotkeys Comma and Period for prev/next symbol in market watch listif you want to change hotkey default keys use this site to find out keyc...
ZigZag NK Sound Alerts notifies you with Sound alert, Push Notification or Popup Notification on terminal when Zigzag changes its bar.This indicator has 3 buffers, two are used for...
NET (Noise Elimination Technology) - a sort of a rolling Kendall rank correlation coefficient -was introduced in one of the rsi indicators posted at this code base.Now it is used t...
This is a sort of stochastic indicator on chart. If, defaults are used, then it calculates the same way as built-in stochastic that uses high/low prices. In this indicator you have...
Indicator is based on calculation of two standard deviations and result is ratio between them.As single indicator it doesnt show direction of price, it only show high activity area...
Recommendations:some experimenting with parameters advised (see the example bellow : red is default, blue is with periods 100,100 - so there is plenty of room for experimenting) ...
When the trigLv level specified in the settings is crossed within the deviation, the indicator sends a push notification to the mobile device if the input parameter notification is...
The Laguerre Filter is a smoothing filter based on Laguerre polynomials. The indicator works by letting you know both the short-term and long-term trend.Buy when the indicator line...
Add Popup or Push Alert notification on manually placed horizontal lines, The lines are deleted and reset itself as soon as price touches these lines...
Simple moving average is calculated by adding prices for last n periods and then dividing that sum by the period. This addition is often done with help of a loop. This loop within ...
1. Shows moving Last Price on Bid Line2. Daily percentage change3. Time based on Input selection to the Price Line : Local, GMT or Current4. Color for Bear and Bull can be set from...
This Indicator was done to fulfill the need from EAs to check on Volume increase and decrease in a extremely simple way.All it does is calculate the average volume of a certain per...
I search Moving Average that can be hide and shown with button, just like in Trading View, but I cannot found it.Then I try to modify example of Moving Average code from MQL5 Metae...
I have use Free indicator for Metatrader 4 from MQL5 in below link, but don't know why the owner remove it.by Taiwo OkunbanjoThen I try to create the indicator myself, for Metatrad...
Recursive Moving Average calls itself a number of times in order to reach the appropriate smoothing. For instance DEMA and TEMA indicators are recursive exponential moving averages...
The Leading Indicator was created by John Ehlers (Cybernetic Analysis For Stocks And Futures pg 235) and as the name implies, this is a leading indicator that provides super early ...
Function, draws arrows and alerts, whenrsi is overbought or soldfor a buy ect, rsi below 30, price opens above the 8 moving averageand the lower wick of the candle is greater than ...
Logic goes, for buy ect. Ao changes direction above zero.Same time as engulfing candle , or close above last candles high.Rsi filters , two. full alerts.Rsi filters can be very use...
Extremely simple indicator, equally extremely crucial and powerful to help traders manage their risk and help EA with automated symbol selection.This indicator uses the ATR to calc...
The idea of the indicator The indicator shows signals ('Arrow' objects) of the 'Moving Average' indicator crossings. The peculiarity of the indicator: if there was an intersection ...
The idea of the indicator In the subwindow, show the filling of the areas between the two lines: the 'RSI' line and the 'RSI' line smoothed with 'MA'.Rice. 1. RSI_MAonRSI_Filling...
The idea of the indicator Show on the chart 'Daily Change' for the last 'Number of bars':Rice. 1. Daily Change Text AlertWhen the specified limit is reached (on the current bar), i...
The idea of the indicatorAdditional style to the iSAR indicator (Parabolic SAR, SAR). Filling the area between the price and the iSAR indicator. Additionally (on the right side) a ...
The idea of the indicator Two lines ('RSI Fast' and 'RSI Slow') smoothed using the 'Moving Average' indicator. Signals can be the intersection of the indicator lines.Rice. 1. RSI_M...
Mt5 indicator alerts for bollinger band and envelope extremes occurring at the same time. Buy signal alerts occur when A bullish candle has formed below both the lower bollinger ba...
The idea of the indicator Assistant indicator. As soon as a rectangle appears on the chart, the indicator draws two lines: along the upper and lower price of the rectangle.The name...