This indicator is using the Exponential Moving Average Calculation Applied to the RSI Data, and allows users to choose the number of periods for the RSI and the number of periods f...
General description : In his June 2020 TASC article "Correlation as a cycle indicator" John Ehlers describes one possible way to determine trend in the marketsHis article describes...
General description : In his June 2020 TASC article "Correlation as a cycle indicator" John Ehlers describes one possible way to determine trend in the marketsHis article describes...
General description : In his June 2020 TASC article "Correlation as a cycle indicator" John Ehlers describes one possible way to determine trend in the marketsHis article describes...
Indicator WaveMTF Bull and Bear System with Signal and Alert for MetaTrader 5 with options to display signal on the chart.Hopefully useful for fellow traders.~ Fix buffers error...
This MT5 indicator is to count down the remaining time of the current bar as the format HH:MM:SSThe label can be positioned with 2 ways:FOLLOW_PRICE --- The label always follows th...
This is a simple indicator calculating most close to real average price per bar on timeframes higher than M1. It uses prices from corresponding M1 bars to get the "effective" (aver...
This indicator is based on the indicator, the features of which make it possible to calculate the phase and amplitude. This can sometimes be helpful.The phase is calculated in degr...
INTRODUCTION: I want to share with you this story. When I started trading, I learnt the scalping strategy in a volatile market. I really loved scalping especially when I see the pr...
Usage:Step chart is displaying values as increments of step size Step size can be specified as fractional pips You can use any of the usual price types to display the chart Reason ...
General description : The random walk index was created by Michael Poulos in order to determine if a security's current price action is exhibiting "random walk" or is the result of...
INTRODUCTION: The story behind this indicator is really interesting. I've published last week a script called "Identify potential Trends/Range (Pivot Points)" and a huge number of ...
Theory : Ocean series of indicators were originally created by Jim Sloman (the theory) and Pat Raffalovich (the coder) - additional information can be obtained in Jim Sloman's boo...
If you can't watch your statistics and your game plan at all time, your emotions will take control and you will start taking ENTRIES such as revenge trade especially when you lose ...
General:Recommendations: Ehlers describes a rather strange way of using it (like using asymmetric threshold for buy and sell, in which case it is clear that he was fitting the indi...
Description :This is the PMO indicatorRecommendations: Trading signals can be derived in a number of ways including momentum, signal line, and zero-line crossovers. ...
Simple Simulator is designed to practice manual trading on historical data.Only close prices are considered, so it is better to use line chart. There is no take-profit, stop-loss o...
Basics :One of the moving averages that is not often made adaptive is SMA (Simple Moving Average). The reason for that is that it is bound to bars values (unlike, for example EMA -...
This Indicator is the Price Range Divided by the Sum of ALL candles within a certain amount of periods defined by user.It has only has 2 inputs:The amount of candles to be consider...
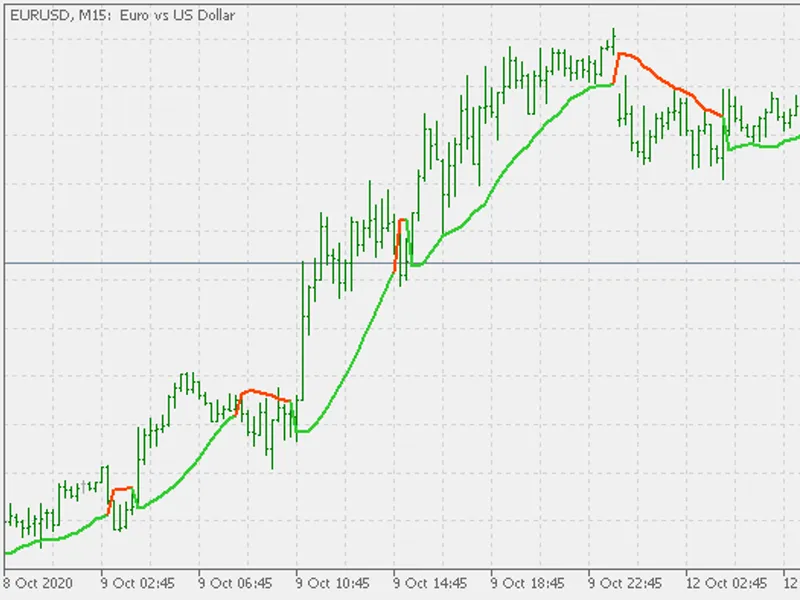
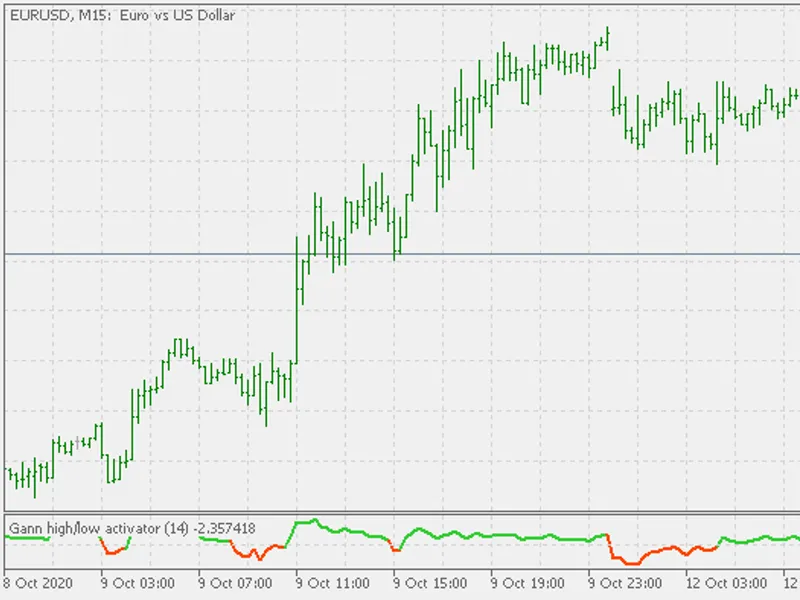
Basics :The Gann High Low Activator Indicator was described by Robert Krausz in a 1998 issue of Stocks & Commodities Magazine. It is a simple moving average SMA of the previous...
Basics :The Gann High Low Activator Indicator was described by Robert Krausz in a 1998 issue of Stocks & Commodities Magazine. It is a simple moving average SMA of the previous...
Indicator DayPivotPoint System with Signal and Alert for MetaTrader 5 with options to display signal on the chart.This Indicator can use only on TF_M1 to H4, and will visually appe...
This indicator is as simple as it gets :it calculates a series of minimums over a certain period of bars it calculates a series of maximums over a certain period of bars then it us...
The cause to make this : When almost all the descriptions of some indicator are something like this :then one starts to wonder what is in that indicator that makes it so "good". Th...
Implementation in the form of an indicator without planned modernisation is attached.That is, we observe the breakdown of the blue line by the body of the candlestick....
Keltner channel indicator with a multiplier and two ways to calculate the boundaries: By averaging the candle body size Averaging the ATR indicator dataThe Keltner channel can be u...
The Camarilla Points indicator shows pivots defined in a special way. The above article contains a detailed description, as well as a possible application strategy....
The Stochastic RSI indicator (Stoch RSI) is essentially an indicator of an indicator. It is used in technical analysis to provide a stochastic calculation to the RSI indicator. Thi...
Draws Pivot Points Level Lines for formula'sFloor Fibonacci Camarilla Woodie ALL Pivot Points Time-FramesDraw long or short lines.Option to Show floor mid pivot pointsOption to sho...
There is no magic in moving averages but they can be used to form the basis of a simple trading strategy that works.For some reason, Forex traders especially enjoy these types of s...
Use the average price to calculate the divergence rate. When the divergence rate is high, the market price may pull back. It is often used in stock trading indicators....
The five classic moving averages are present:Simple moving averageExponential moving averageSmoothed moving averageLinear weightedmoving averageSmoothed moving average The indicato...
REMARK: For this to work perfectly, you must have high speed internetand a high quality Computer. Otherwise, it will not work for you.INTRODUCTION : The breakout strength meter is ...
REMARK: For this to work perfectly, you must have high speed internetand a high quality Computer. Otherwise, it will not work for you.INTRODUCTION : The currency strength meter is ...
This indicator is the same as any other Damiani Voltameter, but I corrected one subtle error that caused it to behave differently when backtesting/optimizing than what can be seen ...
Ichimoku is one of the excellent indicator which can work lonely or with other indicators.With Alerting indicator which send notification to your cell phone whenever Tenkan-sen Cro...
This is a helper indicator which allows you to adjust vertical scale of a subwindow interactively (using keys), which is useful for zooming in and zooming out graphs of your favour...