This indicator summarizes the volatility of multiple periods.the periods used are 3, 4, 5, 6, 8, 10, and 13.Display: red bold line — summarized the volatility. red line — volatil...
INTRODUCTION : Most newbies and immature traders keep losing money because they don't know how important to calculate and see things in terms of percentage. Seeing in terms of perc...
The indicator uses up to three named Label objects, with selectable color, font size, offsets, date formatting and a statistical text showing Last and Current Candle Amplitude (Min...
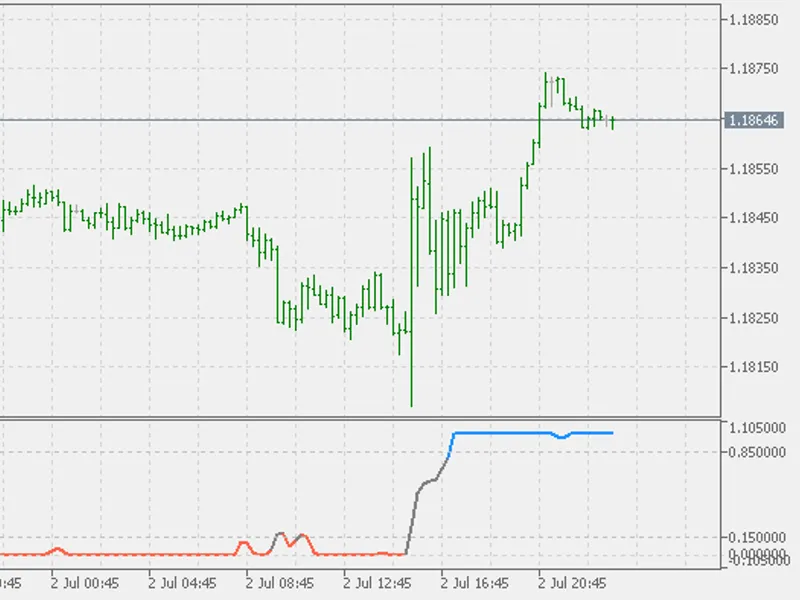
This is a re-write of the old Solar Winds indicator for MQ5. There has recently been some 'excitement' about using this with other indicators for entry signals, and after a request...
Reasons for an upgrade :new builds of metatrader 5 require from time to time some code "refreshment" in order to be up to date regarding the way how code works options for some "fa...
This is a continuation of a series of indicators that might benefit from discontinued signal line calculating modeThis is the CCI that can (and by default it does) use average of p...
Recommendations:Use it in any way you used the regular Rsi(oma) To have it similar to "simple slope mode" (but just similar, you can use very short period : like period 2 - lower e...
This is a variation of discontinued signal line RSI of average (posted here : ) one step furtherRecommendations: Same recommendations apply to this one as the "regular" dsl RSI of...
This Indicator will show the Amplitude [Minimum; Maximum] of a given period and can act as a substitute of the ATR indicator. The indicator can be used to observe volatility and th...
Sometime we have to work with Custom Angles based trendline for price action analysis e.g. 45 degree angle is considered more important for up or down trend.This indicator will hel...
Shows Symbol name, percentage change of price from last day, and Time Time has input options, You can select GMT, LocalTime or TradeServerTimeYou can also set label to any corner y...
Averaging-Down A double-histogram represents the (green) average positive and (red) averagenegative MA Speed, each one averaged-down with a period of # (user input).Example:If aver...
Description Measures current bar's Moving Average Speed, in relation to the average of # (averaging period) past bars.This oscillator can be visually described with .Calculations C...
Colored Candlestick exemplifying a gradient. It was somewhat hard to find a good working example of DRAW_COLOR_CANDLES that was understandable, most of the comments were useless, a...
Display: red line — upper channel. blue line — lower channel. gray line is a standard donchian channel.Settings: channel period — converted to the Euclidean distance. volatility ...
Buy when the indicator line is green and sell when it is red. When the indicator line is below the horizontal line at the "6" level, the indicator considers the situation as flat. ...
The original of this indicator was posted here : . But, since the metatrader 5 platform is evolving and changing a lot, and since we had enough time to learn some nuances, some opt...
atr calculation is done internally (not using built in atr) smoothing is done using built in averages functions though - simply to allow more smoothing modes Recommendations: ...
Most volume/volatility take into account price volatility to determine if price is moving or not. However, they usually fail to get you out of choppy price action. This indicator w...
Volume Colored Candlestick with Bollinger Bands as the Standard DeviationChangelogv1.02b: Hotfix for static int chartBars, where it would be forever the first call value of Bars(Sy...
Buy when the indicator line is green and sell when it turns red.The Fisher Transform indicator is an oscillator that helps to identify trend reversals and can be applied to any fin...
This indicator plots fibonacci channel on last swing high low that can be changed from input variable "ExtDepth"55 is a best parameter which is set by default. It plots a fibonacci...
THE STORY BEHIND THIS TRADING TOOL: Most traders lose and this is a fact. There are lot of reasons behind their losses, but the main reason in my opinion is that they can't control...
After the three average lines are arranged completely according to high and low, it can be regarded as a trend formation. After the pattern is destroyed, the hatching is no longer ...
The HighPass-LowPass Roofing Filter was created by John Ehlers (Cycle Analytics For Traders pg.78)This is a variation of a roofing filter that will let you know which direction the...
History mode to indicator. Set "historyMode" parameter to true then "double click" on any point in price chart to see Support and Resistance zones in that point, is done by Mr. Beh...
History:v 2.3 adds fixes, code improvement and Price-to-MA DistanceInformation:Trade Value depends on Price Positioning,the shape of which can be described also by MA Speed and Pri...
Nadaraya and Watson, both in 1964, proposed to estimate values as a locally weighted average, using a kernel as a weighting functionIt is producing a non-causal (re-calculating) sm...
This is the "Moving Average Bands" indicator with only one change compared to the original : you can chose the price (while in the original only close price is used)Recommendations...
Recommendations: It is not a directional indicator - it indicates volatility You can probably use it for indication of possible trend changes (after the lower extremes are reached...
John Ehlers introduced a variation of rsi calculation (as a part of another indicator) that he decided to call MyRSi. Since it produces results different then the built in rsi, it ...
In December 2020 issue of TASC, John Ehlers published an indicator called MyRsi with NET (MyRsi with Noise Elimination Technology) in which he uses a sort of Kendall (auto)correlat...
Original rex indicator (with an explanation what and how it is done) was posted here :Recommendations:you can use it the same way as any other rex indicator you can use the Donchia...
This indicator allows trader to calculate the proper lot size based on percentage risk and stop loss. The stop loss can be defined either using Average True Range ratio or Fixed si...
This indicator is one of the series of "experiments"even though it is named CCI, it is not actually CCI for that reason a sort of dynamic levels are added (a sort of Donchian chann...
In the December 2021 issue of TASC article “The DMH: An Improved Directional Movement Indicator”, John Ehlers explores a method of modernizing directional movement with Hann window...
Some of the digital filters in one place :Hanning Hamming Blackman Blackman / Harris And (simply in order to demonstrate that almost anything can be a digital filter) :rectangular ...