Chande's DM I - std adaptive with dsl signal lines
This tool for MetaTrader 5 is specifically engineered to streamline your trading operations. This technical indicator acts as a specialized analysis tool designed to visualize market data. It helps traders identify emerging trends, momentum shifts, and key support or resistance levels by plotting statistical calculations directly onto price charts.
How to Setup and Use Chande's DM I - std adaptive with dsl signal lines
1. Installation: Place your file in the MQL/Indicators folder via "Open Data Folder" and restart your terminal.
2. Loading: Find the indicator in the Navigator, drag it onto your chart, and configure the input parameters in the popup window.
3. Customization: Press Ctrl+I to open the indicator list, select your tool, and click "Properties" to change colors, levels, or visual styles.
4. Updating: Replace the old file in the Indicators folder with the new version and restart the platform to apply changes.
Frequently Asked Questions
Q: Why is my indicator not showing? A: Verify the file is in the MQL/Indicators folder, or try right-clicking the "Indicators" tree in the Navigator and clicking "Refresh."
Q: Do custom indicators slow down the platform? A: Too many complex indicators can impact performance; remove unused ones via the "Indicator List" (Ctrl+I).
Q: Can I use MT4 indicators on MT5? A: No, MQL4 and MQL5 are distinct languages; ensure the indicator is compiled specifically for your platform version.
Description & Settings
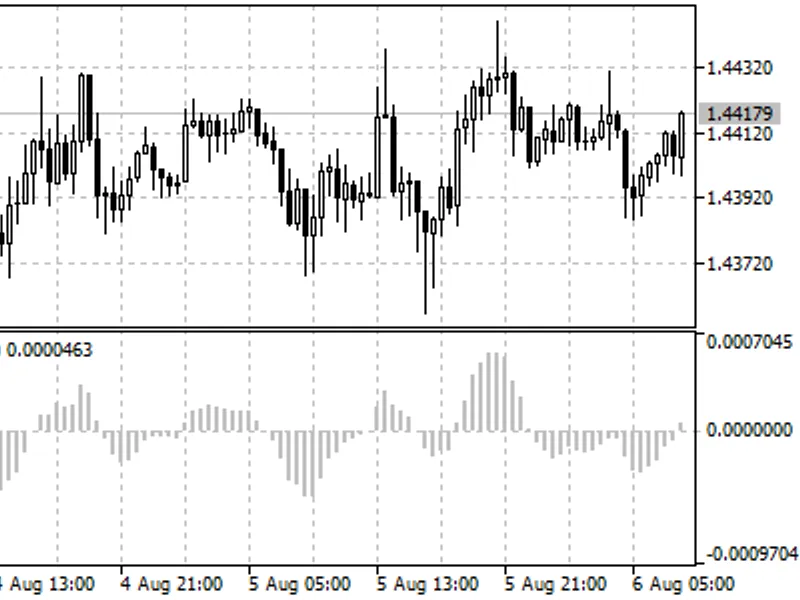
Theory : Original definition of the Tushar Chande's and Stanley Kroll's DMI is the following :The dynamic momentum index is used in technical analysis to determine if a security is overbought or oversold. This indicator, developed by Tushar Chande and Stanley Kroll, is very similar to the relative strength index (RSI). The main difference between the two is that the RSI uses a fixed number of time periods (usually 14), while the dynamic momentum index uses different time periods as volatility changes, typically between five and 30. This version is deviating from it in a number of ways :
it is using RSX instead of RSI for calculation (thus producing a much smoother result)
it is using standard deviation adapting to calculate that RSX
it is adding discontinued signal lines instead of using fixed levels for OB/OS signal
Usage :
You can use color changes as signals. Color change can be one of the following :
color change on slope change
color change on outer dsl signal lines cross
color change on middle dsl signal lines cross. the middle signal line is calculated as the average of upper and lower, which makes it a good new "zero" line (or 50 line in case of DMI)