





triple timeframe cci indicator
Info
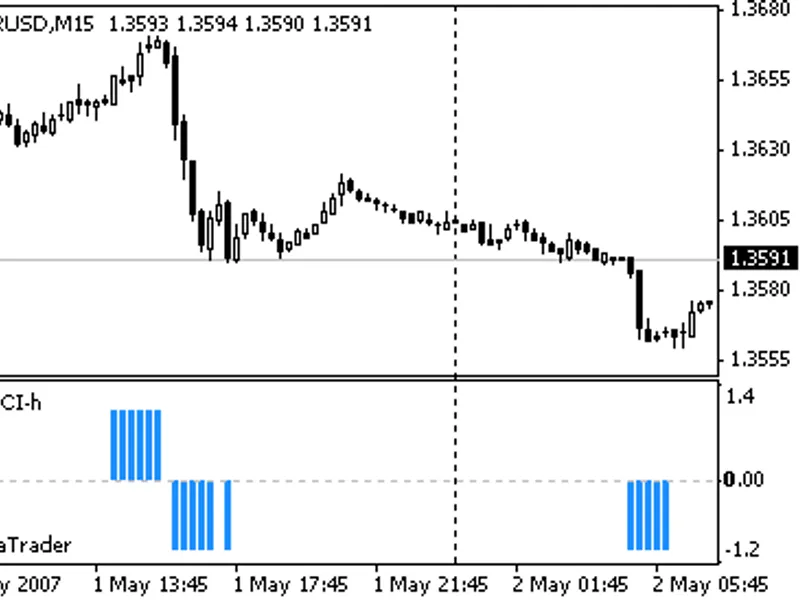
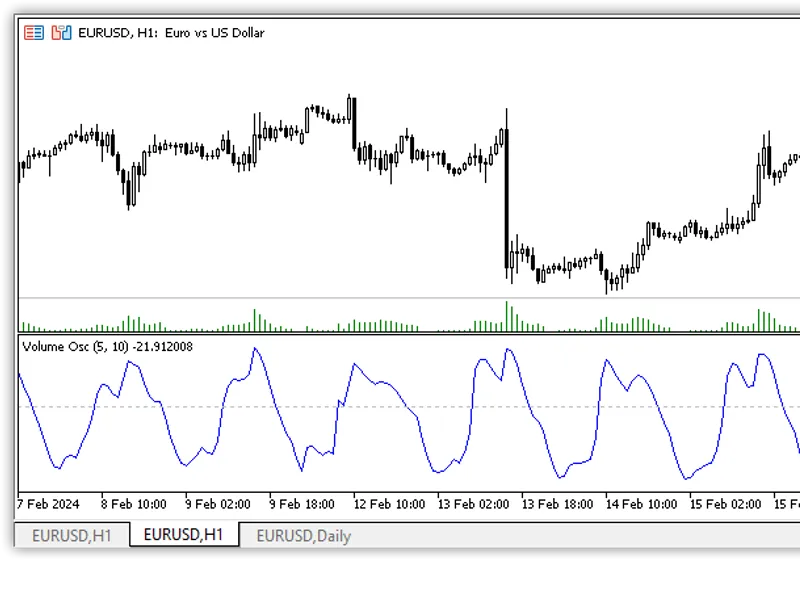
The triple timeframe cci indicator is a Script for MetaTrader 4 that cci (commodity channel index) with 3 timeframes in one. this is essentially a signal indicator, as it shows when a certain cci level is exceeded simultaneously across three timeframes.
Usage
This tool is typically used for enhancing chart analysis and decision making.
Platform
This Script works exclusively on MetaTrader 4 (both build 600+ and newer versions).
Setup
Place the downloaded file in MQL4/Scripts folder via File ? Open Data Folder in MetaTrader 4.
How to Install and Use triple timeframe cci indicator
1. Installation: Move your script file into the MQL/Scripts directory and restart the platform.
2. Execution: Drag the script onto a chart; it will perform a one-time action, such as closing all open orders or clearing chart objects.
3. Editing: Use MetaEditor (F4) to modify code, click "Compile," and verify no errors appear in the terminal before running.
4. Removing: Scripts stop automatically, but you can remove them manually by right-clicking the chart and choosing "Remove Script."
Frequently Asked Questions
Q: How are scripts different from EAs? A: Scripts execute a single action and then stop; EAs monitor the market and trade continuously.
Q: Can I assign a hotkey to a script? A: Yes, right-click the script in the Navigator, select "Set Hotkey," and define your preferred keyboard shortcut.
Q: Why did my script stop? A: Scripts are designed to stop immediately after finishing their programmed command; this is normal behavior.
What this tool does
cci (commodity channel index) with 3 timeframes in one.
Typical Use Case
This Script excels in automated trading and technical analysis on MetaTrader 4.
Compatible Platform & Setup
This Script works on MetaTrader 4. Place the file in the MQL4/Scripts folder and restart the terminal.
Description & Settings
Related: Big Bars Indicator for Higher Timeframes - another powerful script for MetaTrader 4 traders.
cci (commodity channel index) with 3 timeframes in one.Also recommended: Multi-Timeframe AO and MACD Indicator with Color Lines - similar script with strong performance on MetaTrader 4.
this is essentially a signal indicator, as it shows when a certain cci level is exceeded simultaneously across three timeframes. this is displayed as a histogram bar.
the indicator offers the following configurable parameters:
- cci_period_0: cci period for the current timeframe.
- level_0: cci level for the current timeframe.
- tf_1: duration in minutes for the first timeframe.
- cci_period_1: cci period for the first timeframe.
- level_1: cci level for the first timeframe.
- tf_2: duration in minutes for the second timeframe.
- cci_period_2: cci period for the second timeframe.
- level_2: cci level for the second timeframe.
- numberofbars: number of bars for calculation (0 for all).
You may also like: multi timeframe moving average indicator - excellent alternative for script users on MetaTrader 4.
Source Code
#property copyright "RobotFX"
#property link "https://robotfx.org"
#property indicator_separate_window
#property indicator_buffers 1
#property indicator_color1 DodgerBlue
#property indicator_maximum 1.4
#property indicator_level1  0
#property indicator_minimum -1.2
extern int CCI_Period_0 = 14;     // Период CCI для текущего ТФ
extern int Level_0      = 100;    // Уровень CCI для текущего ТФ
.......
⚠ Limitations & Risk Warning
- This tool is provided for educational and testing purposes only.
- Past performance does not guarantee future results.
- Trading involves substantial risk of loss. Use on a demo account first.
- Results may vary depending on market conditions, broker, and settings.
- We recommend thorough backtesting and forward testing before using with real funds.