Volume Divergence Markers (VD M)
This tool for MetaTrader 4 is specifically engineered to streamline your trading operations. This technical indicator acts as a specialized analysis tool designed to visualize market data. It helps traders identify emerging trends, momentum shifts, and key support or resistance levels by plotting statistical calculations directly onto price charts.
How to Setup and Use Volume Divergence Markers (VD M)
1. Installation: Place your file in the MQL/Indicators folder via "Open Data Folder" and restart your terminal.
2. Loading: Find the indicator in the Navigator, drag it onto your chart, and configure the input parameters in the popup window.
3. Customization: Press Ctrl+I to open the indicator list, select your tool, and click "Properties" to change colors, levels, or visual styles.
4. Updating: Replace the old file in the Indicators folder with the new version and restart the platform to apply changes.
Frequently Asked Questions
Q: Why is my indicator not showing? A: Verify the file is in the MQL/Indicators folder, or try right-clicking the "Indicators" tree in the Navigator and clicking "Refresh."
Q: Do custom indicators slow down the platform? A: Too many complex indicators can impact performance; remove unused ones via the "Indicator List" (Ctrl+I).
Q: Can I use MT4 indicators on MT5? A: No, MQL4 and MQL5 are distinct languages; ensure the indicator is compiled specifically for your platform version.
Description & Settings
This indicator places a marker on a chart based on a divergence between trade volumes and bar sizes, i.e. if bar size has been decreasing/increasing for N continuous bars and volume has been doing the opposite, a marker will be placed.
Usually, the markers are placed near the peaks before a reverse or in the middle of a technical correction during a trend. This indicator can be used to identify potential entry or exit points, depending on the configuration of input parameters. VDM does not provide complete information about potential trades if used without other indicators.
Higher input variables values mean less frequent signals. I am currently experimenting on how the false signals can be filtered. Also, a complementary indicator, which shows the direction in which the positions should be opened, is currently in development. Feel free to post your suggestions about improving this indicator.
UPDATE 27.05.2015: I have added the lines between markers, as requested. By default, they will be the same color as the markers.
Input variables:
Whether or not zero bar should be counted.
Convergence or divergence switch (convergence creates markers if both volume and bar sizes are moving in the same direction; divergence - in the opposite).
How long the volume has to increase/decrease to trigger the marker (in bars).
How long the bar size has to increase/decrease to trigger the marker (in bars).
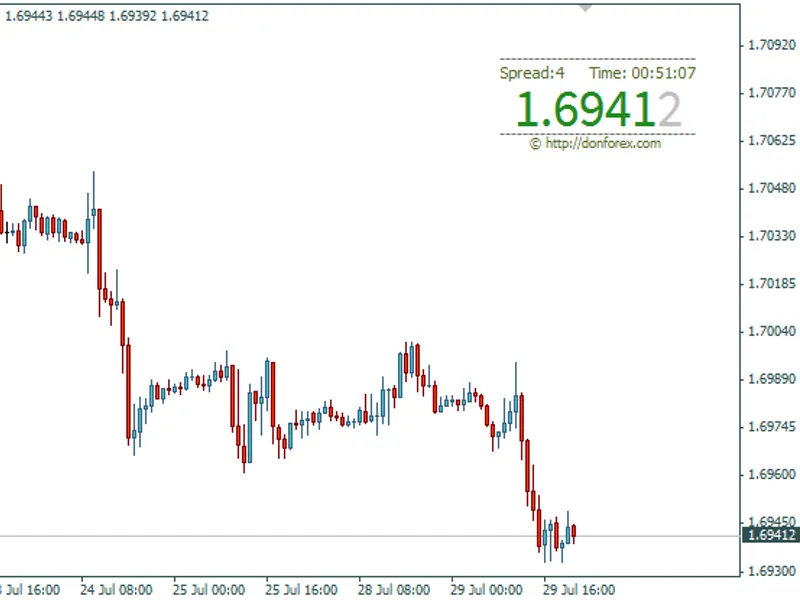
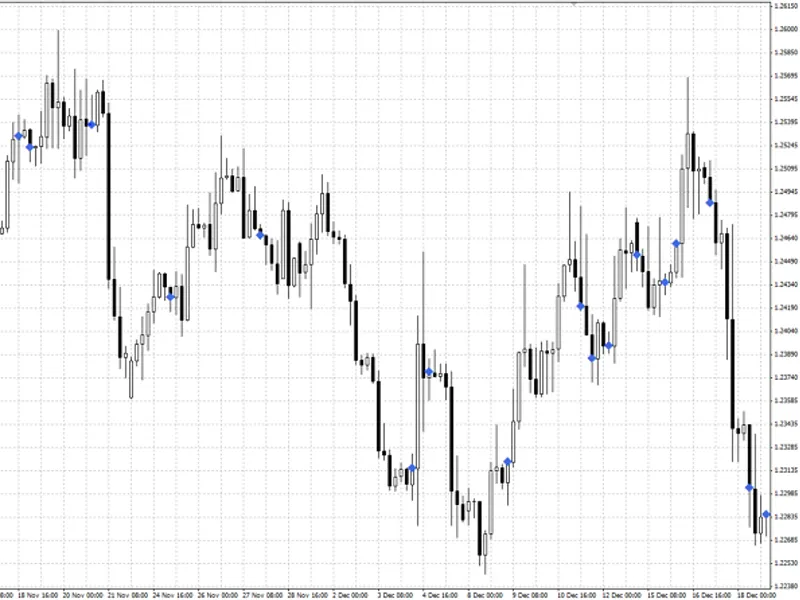
This is how it looks like:
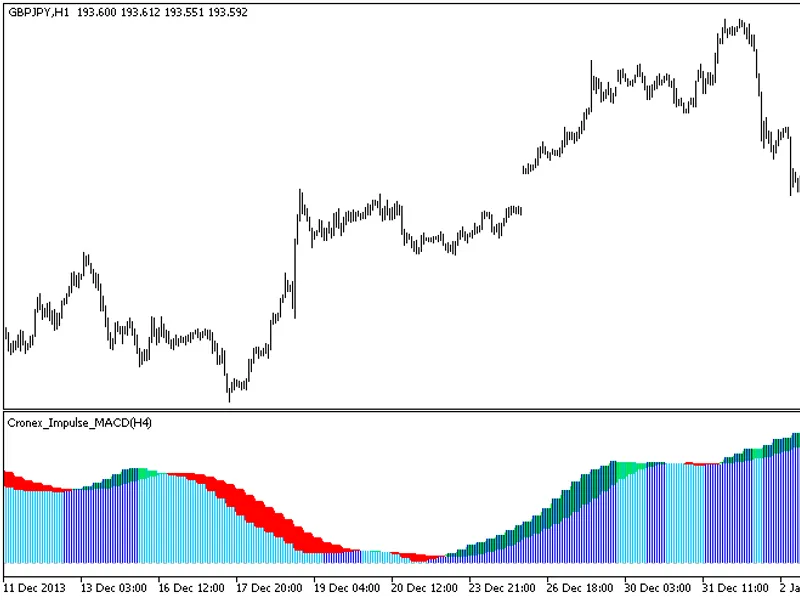
This is to demonstrate the potential profits:
Recommendations:
The purpose of this indicator is to maximise profits by opening/closing trades at optimal entry/exit points.
The optimal values for input variables are somewhere between 1-3 bars. Values above 4 are pointless because it never happens on a market.
Works best during flat price movements.
IMPORTANT! Do not use this indicator on its own to open any trades because it doesn't show the direction of price movement.