EA S Y TR E N D
This professional-grade solution for MetaTrader 4 helps traders achieve greater efficiency in their daily workflow. This technical indicator acts as a specialized analysis tool designed to visualize market data. It helps traders identify emerging trends, momentum shifts, and key support or resistance levels by plotting statistical calculations directly onto price charts.
How to Setup and Use EA S Y TR E N D
1. Installation: Place your file in the MQL/Indicators folder via "Open Data Folder" and restart your terminal.
2. Loading: Find the indicator in the Navigator, drag it onto your chart, and configure the input parameters in the popup window.
3. Customization: Press Ctrl+I to open the indicator list, select your tool, and click "Properties" to change colors, levels, or visual styles.
4. Updating: Replace the old file in the Indicators folder with the new version and restart the platform to apply changes.
Frequently Asked Questions
Q: Why is my indicator not showing? A: Verify the file is in the MQL/Indicators folder, or try right-clicking the "Indicators" tree in the Navigator and clicking "Refresh."
Q: Do custom indicators slow down the platform? A: Too many complex indicators can impact performance; remove unused ones via the "Indicator List" (Ctrl+I).
Q: Can I use MT4 indicators on MT5? A: No, MQL4 and MQL5 are distinct languages; ensure the indicator is compiled specifically for your platform version.
Description & Settings
(You need use Heiken Ashi to see the graph or change the parameter ti put the graph in front of the indicators)
So I choose a H1 PERIOD to have a strong trend, I write a histogramme whith appropriate colors, and I put the all in MTF to have a better view in M1 or M5 PERIOD
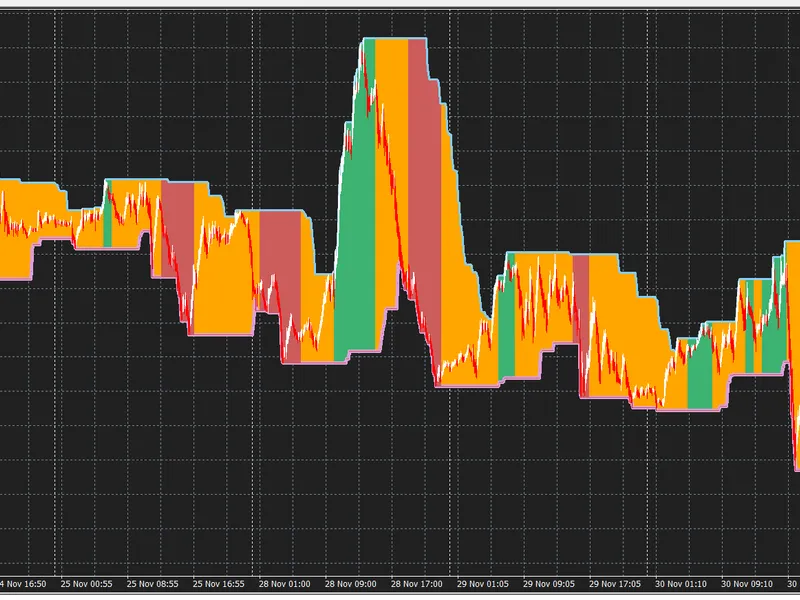
EASY -> Green = UpTrend // Orange = not defined // Red = DownTrend
The Bollinger inverse is just a bollinger Band inicator whith lower-mode parameter for the upperBB line and upper-mode parameter for the lowerBB.
When a very fast Ma cross the upperBB, is probably a uptrend and when is crossing the lowerBB, is probably a downtrend.
(bollinger inverse + MA + Heiken Ashi)
So I choose a H1 PERIOD to have a strong trend, I write a histogramme whith appropriate colors, and I put the all in MTF to have a better view in M1 or M5 PERIOD
when MA > UPPERBB -> Grenn, MA < UPPER && MA > LOWERBB -> Oraange, MA < LOWERBB -> RED
(a-TENDANCE-H1-chart-window + Heiken Ashi)
and I put the histogram in a MaxMinBand channel.
So you have to ajust the parameters of BBinverse, period, deviation and shift, and the parameters of the fast MA
and the Time Frime .
I prefere
extern int TimeFrame=60;
//---- input parameters Bollinger-inverse
extern int ainpperiod = 10;
extern double ainpdeviation =1.25 ;
extern int ainpshift = 1;
//---- input parameters Ma
extern int aperiodma = 3;
extern int ashiftma = 0;
extern int amethodma = 3;
extern int apricema = 5;
//---- input parameters MaxMinChannel
extern int Band_PeriodMM = 90;
extern int SiftMM = 1;
But please, let me know your let me know your parameters preferences .