






adaptive volatility analysis
Info
The adaptive volatility analysis is a Indicator for MetaTrader 4 that the ava (adaptive volatility analysis) indicator is a tool i've developed, primarily for enhancing my own indicators and expert advisors (eas). it's designed to gauge market price movements with greater precision.
Usage
This tool is typically used for enhancing chart analysis and decision making.
Platform
This Indicator works exclusively on MetaTrader 4 (both build 600+ and newer versions).
Setup
Place the downloaded file in MQL4/Indicators folder via File ? Open Data Folder in MetaTrader 4.
How to Install and Use adaptive volatility analysis
1. Installation: Place your file in the MQL/Indicators folder via "Open Data Folder" and restart your terminal.
2. Loading: Find the indicator in the Navigator, drag it onto your chart, and configure the input parameters in the popup window.
3. Customization: Press Ctrl+I to open the indicator list, select your tool, and click "Properties" to change colors, levels, or visual styles.
4. Updating: Replace the old file in the Indicators folder with the new version and restart the platform to apply changes.
Frequently Asked Questions
Q: Why is my indicator not showing? A: Verify the file is in the MQL/Indicators folder, or try right-clicking the "Indicators" tree in the Navigator and clicking "Refresh."
Q: Do custom indicators slow down the platform? A: Too many complex indicators can impact performance; remove unused ones via the "Indicator List" (Ctrl+I).
Q: Can I use MT4 indicators on MT5? A: No, MQL4 and MQL5 are distinct languages; ensure the indicator is compiled specifically for your platform version.
What this tool does
the ava (adaptive volatility analysis) indicator is a tool i've developed, primarily for enhancing my own indicators and expert advisors (eas).
Typical Use Case
This Indicator excels in automated trading and technical analysis on MetaTrader 4.
Compatible Platform & Setup
This Indicator works on MetaTrader 4. Place the file in the MQL4/Indicators folder and restart the terminal.
Description & Settings
Related: volatility change indicator - another powerful indicator for MetaTrader 4 traders.
the ava (adaptive volatility analysis) indicator is a tool i've developed, primarily for enhancing my own indicators and expert advisors (eas). it's designed to gauge market price movements with greater precision. unlike standard indicators that offer a static view of the market, the ava adapts its analysis based on current market dynamics. this adaptability makes it valuable for predicting shifts towards higher volatility or calmer periods. this indicator was mainly designed to be used called by genetic algorithms.
Also recommended: starc bands: understanding market volatility - similar indicator with strong performance on MetaTrader 4.
how it operates:starting with atr
: the foundation of the ava indicator is the average true range (atr), which quantifies market movement over a set number of past trades (typically 14 trades by default).
smoothing with emas
: the indicator employs two exponential moving averages (emas) applied to the atr values - a short-term ema (default is 2) and a long-term ema (default is 5), for longer term analyisis we can opt for longer periods, for example 10 and 50. these emas help to smooth out the atr readings, making it easier to identify price movement trends.
the fav ratio
: the core of the ava indicator is the fav (factor of adaptive volatility), calculated by dividing the short-term ema by the long-term ema of atr values. this ratio adjusts the indicator's sensitivity to market changes, ensuring it remains responsive to both subtle and significant shifts.
determining ava value
: the final ava value is derived by modifying the fav ratio: subtract 1 from fav, then multiply by 100. this results in a percentage that represents the current market volatility level.
exact calculation: ava = (fav - 1) × 100
where,
fav = ema_short(atr) / ema_long(atr)
usage guidelines:
interpreting the indicator
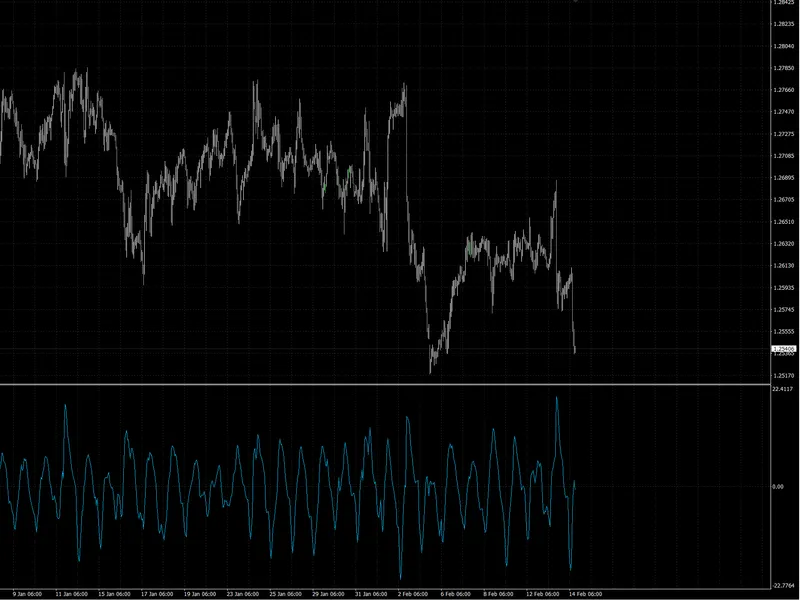
: the ava indicator appears in a separate chart beneath your main trading chart. an increasing ava value signifies rising market volatility, whereas a decreasing value indicates reduced volatility or stability.
application insights
: in periods of growing volatility, consider strategies that capitalize on significant price movements. conversely, when volatility diminishes, it might be prudent to wait for clearer trading signals or to opt for strategies better suited to stable markets.
You may also like: chaikin's volatility indicator - excellent alternative for indicator users on MetaTrader 4.
Source Code
#property copyright "RobotFX"
#property link "https://robotfx.org"
#property version   "1.00"
#property strict
#property indicator_separate_window
#property indicator_buffers 1
#property indicator_color1 DeepSkyBlue // AVA Line
input int atrPeriod = 14; // Period for ATR
input int shortEmaPeriod = 2; // Short period for EMA
input int longEmaPeriod = 5;  // Long period for EMA
.......
⚠ Limitations & Risk Warning
- This tool is provided for educational and testing purposes only.
- Past performance does not guarantee future results.
- Trading involves substantial risk of loss. Use on a demo account first.
- Results may vary depending on market conditions, broker, and settings.
- We recommend thorough backtesting and forward testing before using with real funds.