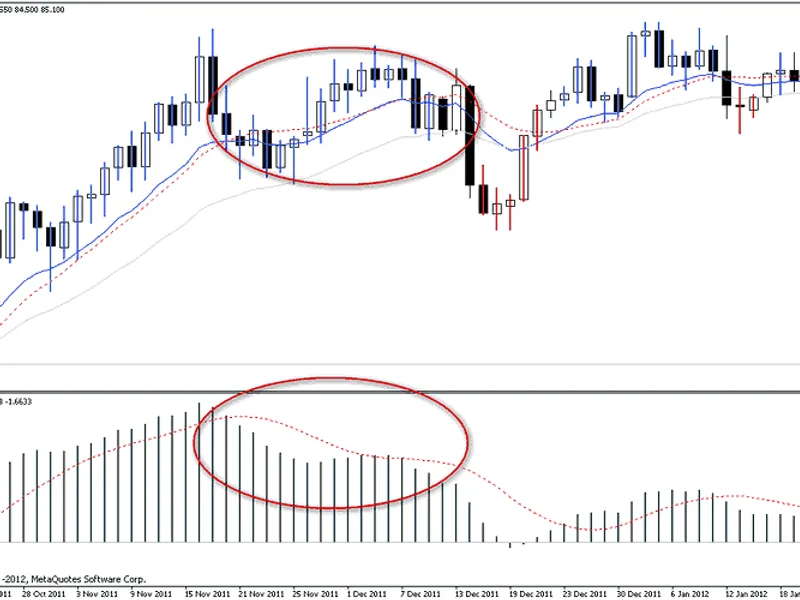
a standard macd indicator displayed on the price chart. as shown in the image, the indicator provides a clear visual representation of the macd signal line's movement and direction...
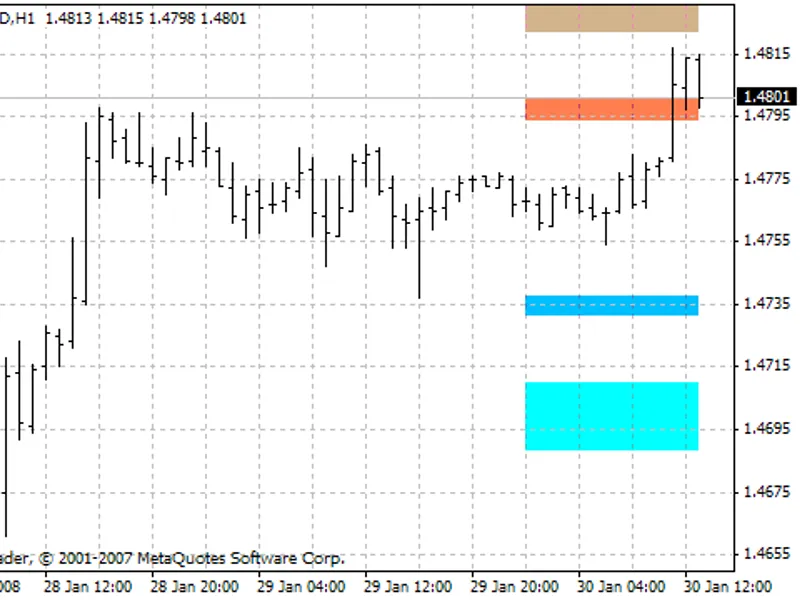
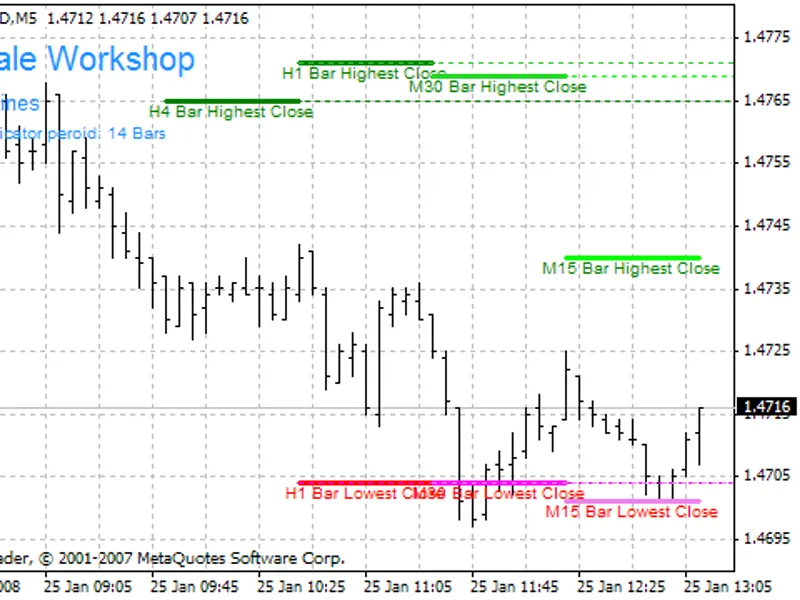
this indicator displays three higher timeframes within the current chart window.on the m1 chart, as shown in the screenshot:- blue rectangles represent daily bars.- yellow rectangl...
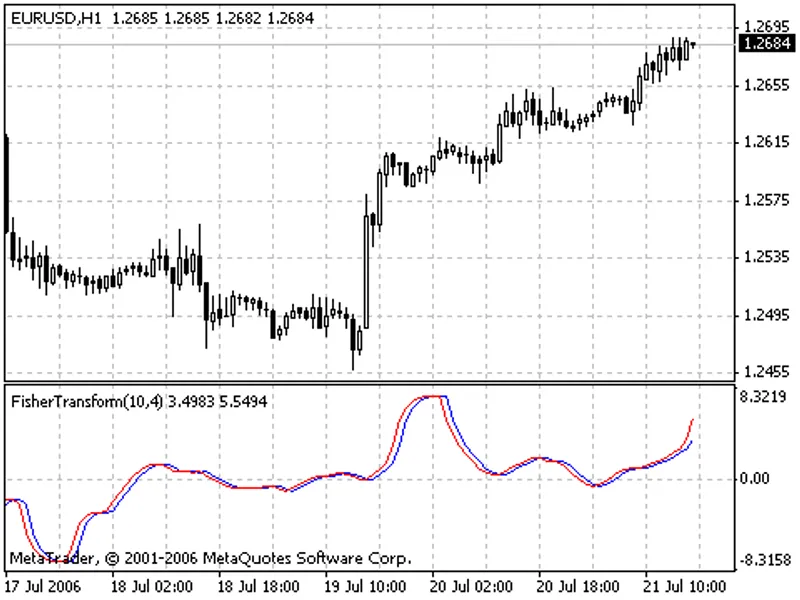
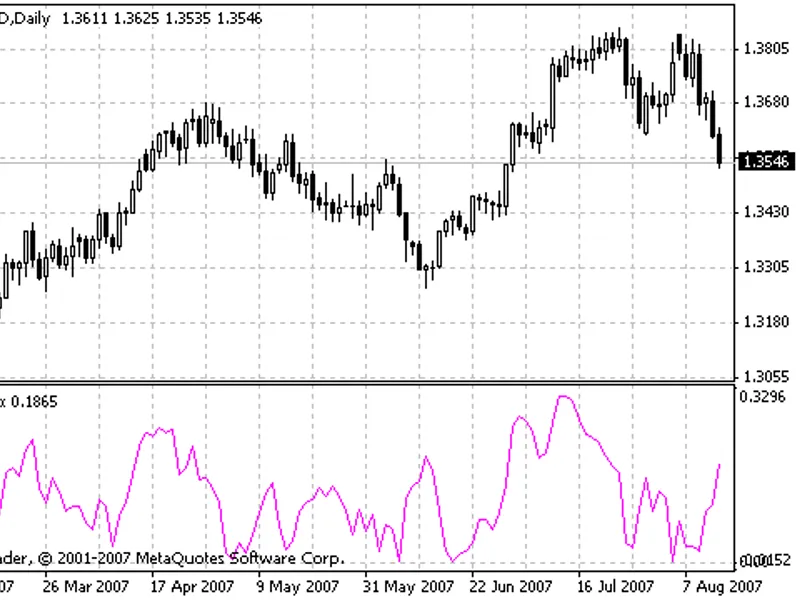
fisher organization indicator version 1 is a tool for metatrader products.
this is paragraph one.
this is paragraph two.
introduction to fisher organization indicator
- indicato...
williams b indicator
this indicator provides trading signals based on five dimensions of chaos theory.
at the top, it displays the current symbol and price.
1 - first dimension:...
the strategy involves buying at the price of the 3-bar moving average of lows and closing the position at the 3-bar moving average of highs.parameters:- extern bool ifhour = true; ...
the structural flaw in retail volume analysisstandard retail volume indicators simply plot vertical bars showing the total number of transactions within a time period. this data is...
this indicator combines the relative strength index (rsi) with the kalman filter. it provides a unique perspective on market trends and is presented in a separate window for easy r...
this is a comprehensive indicator named 'Сwlx bw5 zone', offering valuable assistance to traders within the metatrader platform. it adheres to the standard conventions of mt4/mt5, ...
this indicator identifies potential support and resistance levels based on fibonacci retracements.it calculates and displays key fibonacci levels on the chart, aiding traders in id...
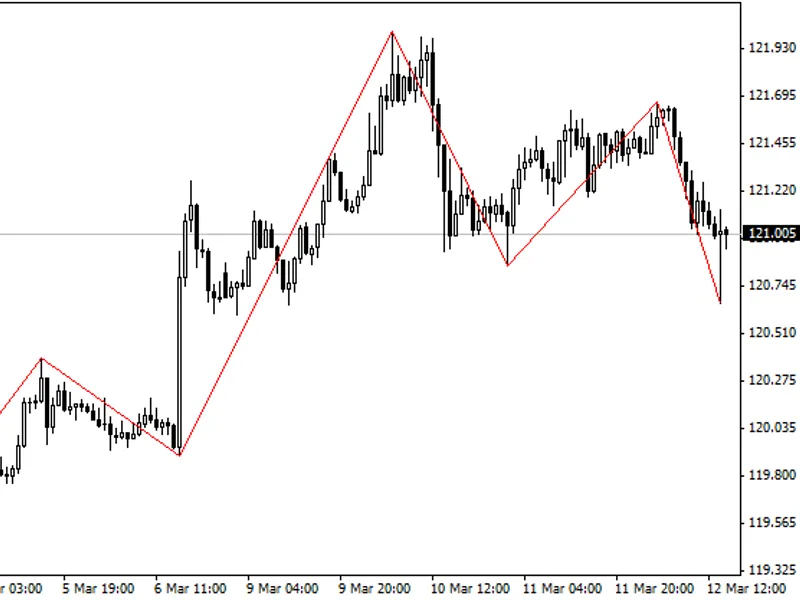
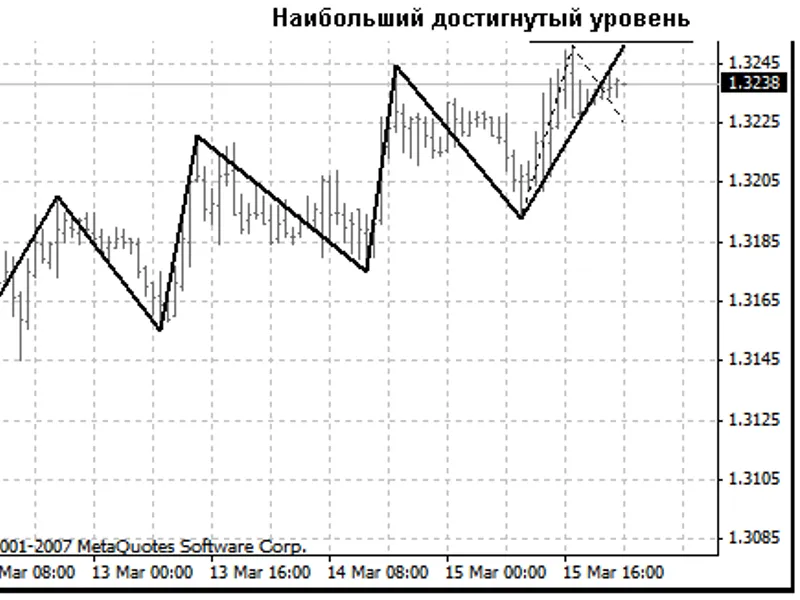
the zigzag indicator is a powerful tool that tracks and connects extreme points on a chart, ensuring the distance between these points meets or exceeds a specified percentage for t...
this comprehensive indicator suite, named 'pivot rs session', is tailored for metatrader platforms (mt4/mt5). it offers a reliable and user-friendly experience, adhering to standar...
the res-sup indicator suite is a comprehensive set of 4 tools designed to enhance the trading experience on metatrader platforms (mt4/mt5). this powerful collection adheres to the ...
this indicator is a useful tool for traders using metatrader 4 or 5. it provides a simple and effective way to round prices to the nearest specified value, offering a clear view of...
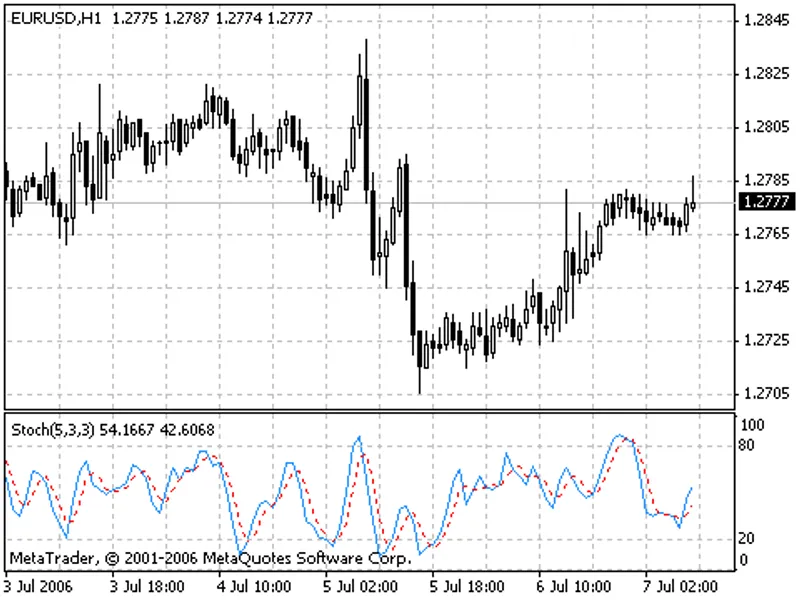
the stochastic oscillator technical indicator is a powerful tool for traders, comparing a security's closing price to its price range over a specified time period.this indicator is...
the absolute strength indicator suite is a comprehensive set of 4 tools designed to enhance trading experiences on metatrader platforms (mt4/mt5). this powerful collection adheres ...
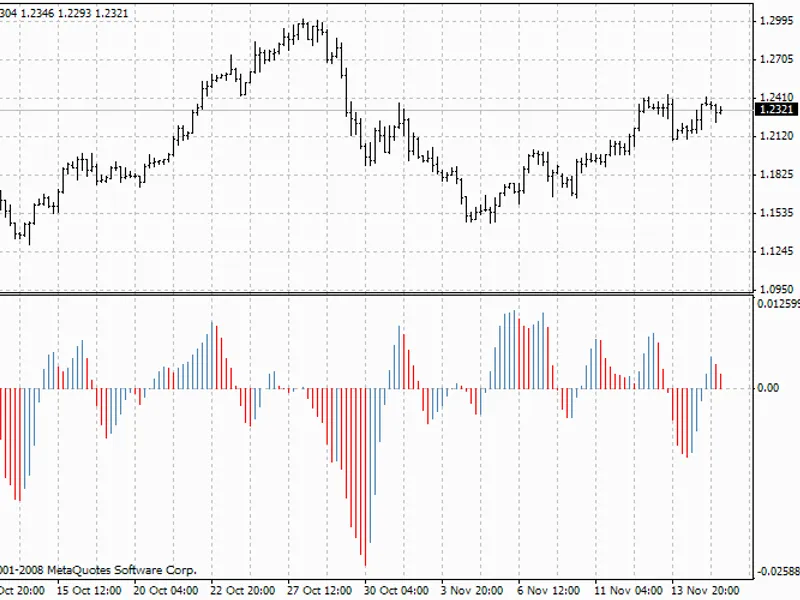
the moving average of oscillator (osma) is a technical indicator that measures the difference between an oscillator and its smoothing line. in this context, the moving average conv...
the at_itp(t)env indicator is a powerful tool for traders, offering a comprehensive view of market trends and patterns.this indicator provides a detailed analysis of the market env...
moving average convergence/divergence (macd) is a trend-following dynamic indicator that measures the correlation between two price moving averages.the macd is calculated as the di...
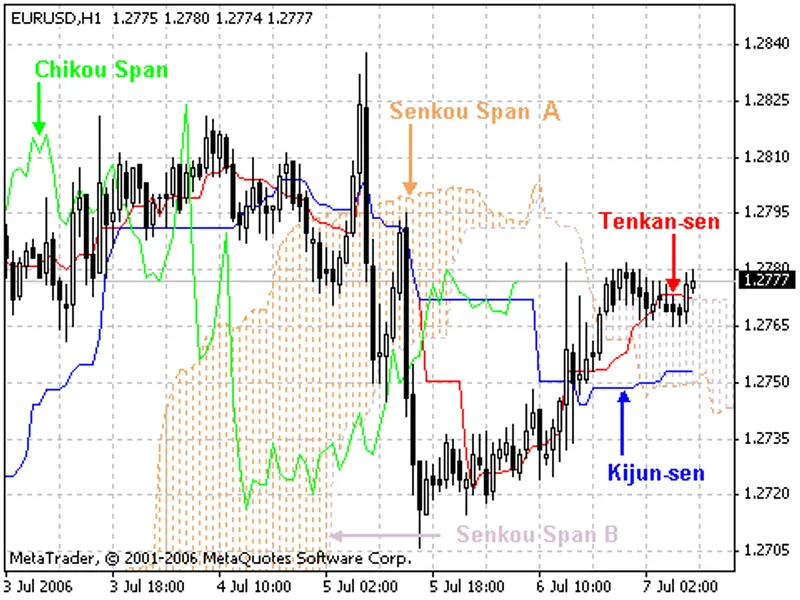
the ichimoku kinko hyo technical indicator is designed to identify market trends, support and resistance levels, and generate buy and sell signals. it is most effective on weekly a...
this comprehensive indicator suite, named 'darvas boxes', is tailored for metatrader platforms (mt4/mt5). it offers a robust set of features to enhance trading strategies and decis...
the klines indicator suite is a comprehensive set of 4 tools designed to enhance the trading experience on metatrader platforms (mt4/mt5). this powerful collection adheres to the s...
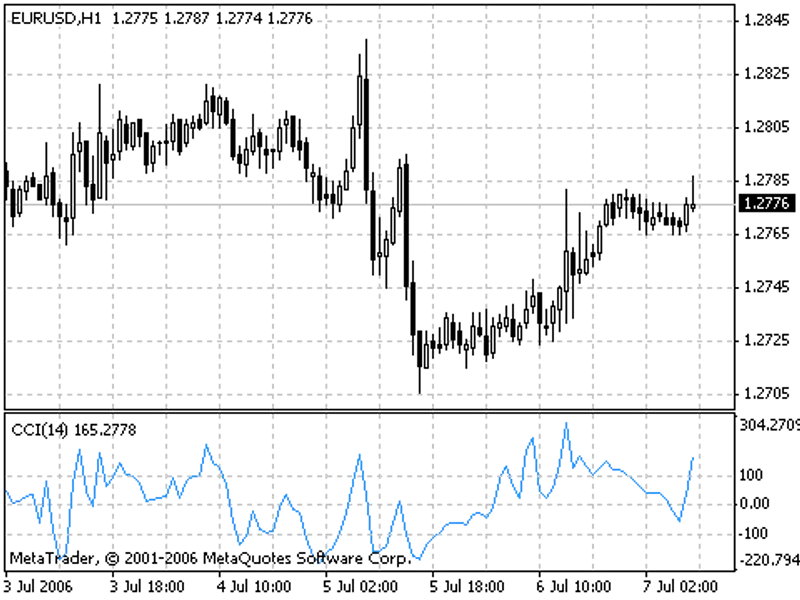
the commodity channel index (cci) is a versatile indicator that measures the deviation of an asset's price from its statistical average.this indicator is particularly useful for id...
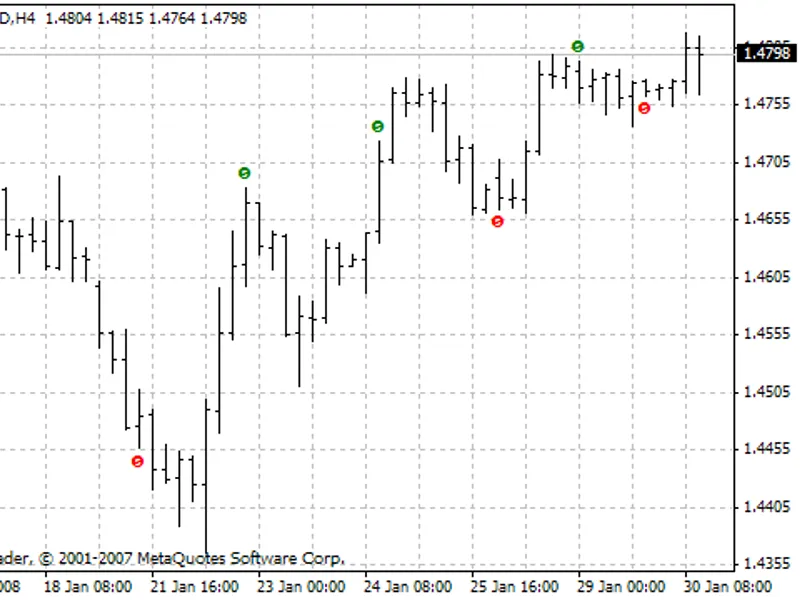
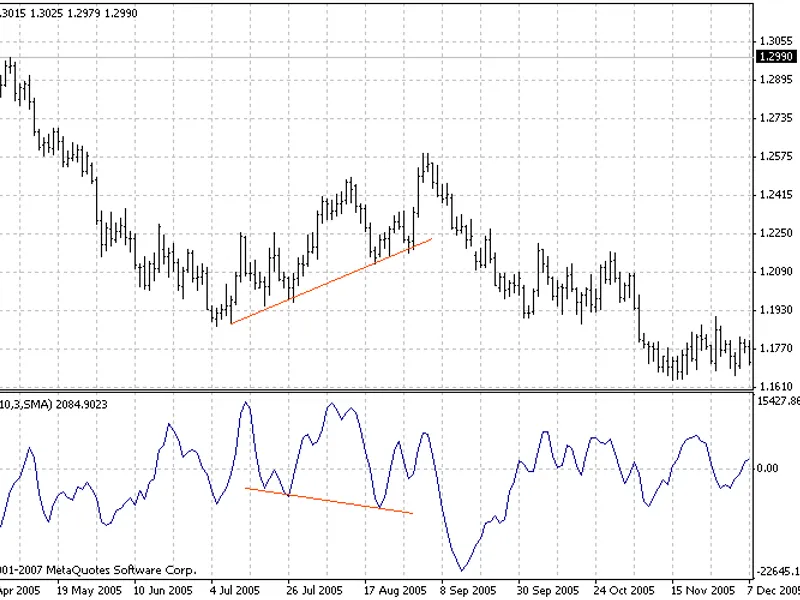
this indicator utilizes the divergence theory to generate trading signals. the indicator displays red arrows for sell signals and green arrows for buy signals, providing a visual r...
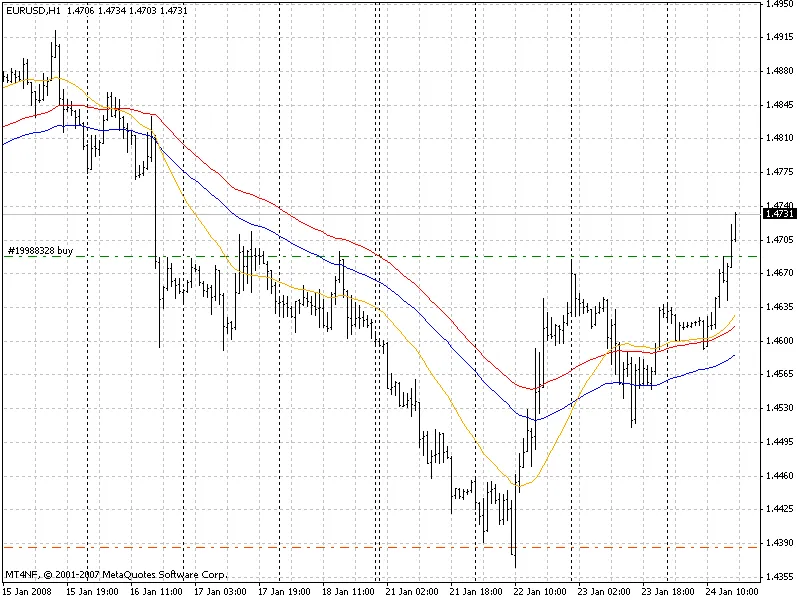
the impulse ma c d indicator is designed to provide a comprehensive trading system by combining three moving average (ma) indicators.the first indicator is the smma ma of high, and...
the acceleration/deceleration indicator (ac) measures the acceleration and deceleration of the current driving force. this indicator can predict changes in the driving force, which...
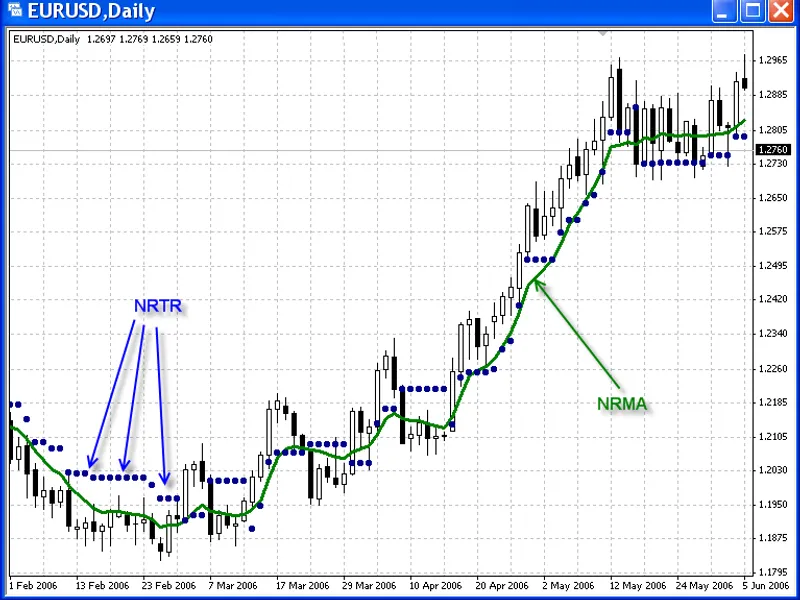
nrma is a renowned indicator that has produced various realizations of the nrtr indicator. this version features a moving average (line) and trailing stops nrtr (points). it provid...
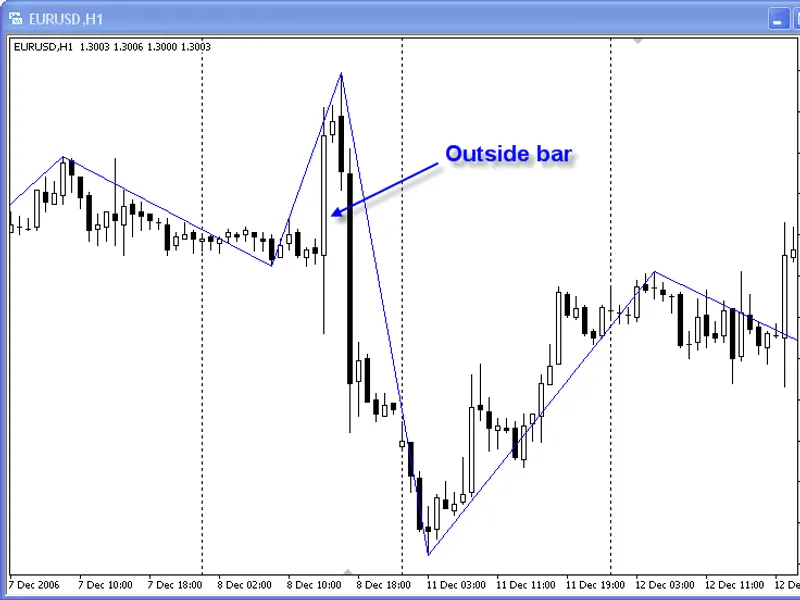
the zigzag2_r indicator is an advanced tool for metatrader 4 and 5 platforms, offering a unique approach to trend analysis and visualization.it utilizes the draw_zigzag style, whic...
the chaikin oscillator is a technical analysis tool that measures the accumulation and distribution of volume over a specified period.calculation:1. chaikin accumulation/distributi...
the block structure and transparency of the algorithm, along with the minimum necessary documentation, allow for easy modification to suit your needs....
this indicator provides a reliable trading signal, similar to a moving average (ma) crossover, but with enhanced accuracy. it generates buy and sell signals when the trendlines int...
this indicator provides valuable insights into market conditions by analyzing fractal dimensions. it doesn't indicate trend direction but reveals whether the market is in a trendin...
this indicator provides support and resistance lines similar to the camarilla indicator. it offers a comprehensive view of potential price reversals, aiding traders in making infor...
this indicator visually represents the start and end times of three major trading sessions: asian, european, and american. the sessions are depicted using background rectangles, wh...
to describe the principle of operation, a citation from the book statistika dlya tradera (statistics for a trader) is provided below:ydema can be found in the code base....
this is a supplementary indicator that enhances the existing slope direction line.it is built upon a multi-timeframe (mtf) concept, requiring a basic indicator to function. the nec...
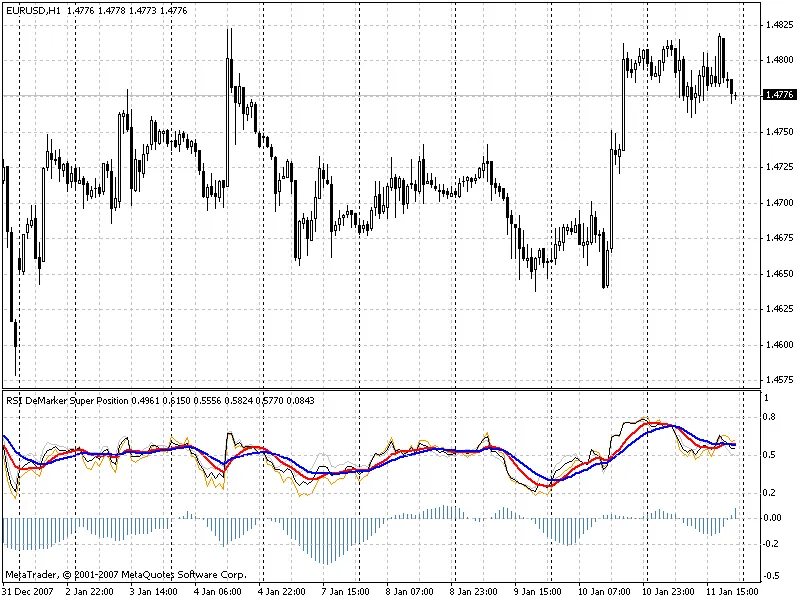
one more indicator from the series of super positions.the principle is the same as in other indicators, but for the stochastic oscillator and %r.currently, there is no correlation ...
the concept behind this indicator is straightforward and intuitive. it's surprising that similar indicators haven't been developed before.prices fluctuate, either rising or falling...
special features:- search for zz breaks only at the availability of a maximum or minimum of the approximating curve (snake), skipping other irrelevant extremums.- zz is calculated ...
this indicator is designed to streamline the process of analyzing and comparing multiple indicators with varying parameters, saving valuable time.the development of this indicator ...
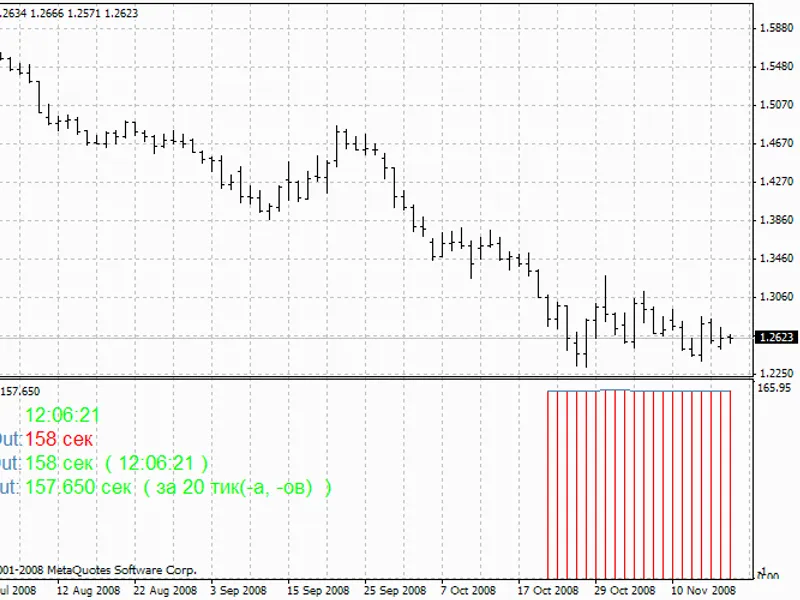
this indicator measures the time between a broker sending a quote and you receiving it, displaying current, maximum, and minimum lag.note: for accurate results, ensure your system ...
this indicator calculates and displays the average amplitude of price movements over a specified period.the indicator shows the following values:- whole length of the candlestick (...
this indicator calculates and displays the average amplitude of price movements over the entire chart history.the indicator shows the following values:1. total candlestick length: ...
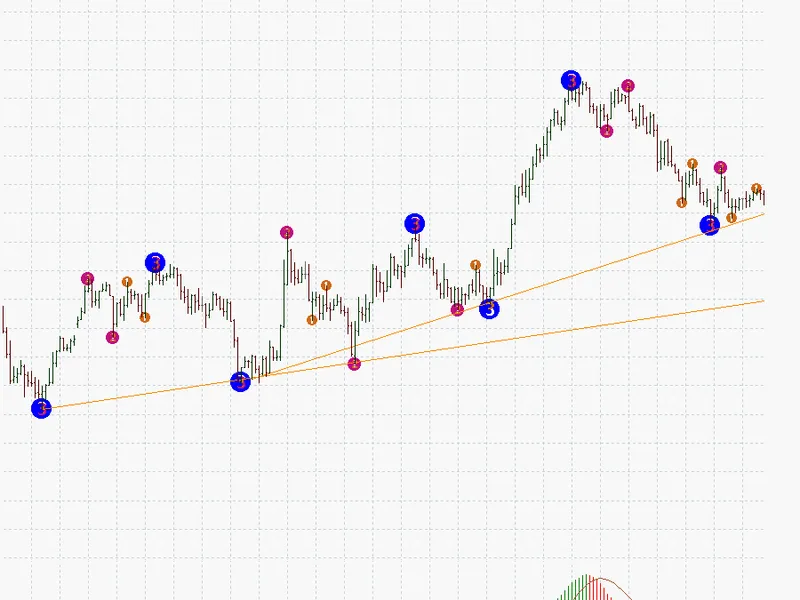
this indicator places semaphore points on the maximum and minimum of three different periods, providing a visual representation of price movements.the zigzag calculation is based o...
this is a comprehensive indicator suite named 'mt f rc i'. designed for the metatrader platform, it offers a range of features to enhance trading activities. the indicator set adhe...
jurik - jcfbaux indicator.this indicator is a powerful tool for traders, offering a comprehensive view of market trends and potential opportunities....
this indicator calculates the average daily range of a financial instrument over a specified period.it provides a simple yet powerful tool to analyze market volatility and identify...