Impulse MA C D
This tool for MetaTrader 4 is specifically engineered to streamline your trading operations. This technical indicator acts as a specialized analysis tool designed to visualize market data. It helps traders identify emerging trends, momentum shifts, and key support or resistance levels by plotting statistical calculations directly onto price charts.
How to Setup and Use Impulse MA C D
1. Installation: Place your file in the MQL/Indicators folder via "Open Data Folder" and restart your terminal.
2. Loading: Find the indicator in the Navigator, drag it onto your chart, and configure the input parameters in the popup window.
3. Customization: Press Ctrl+I to open the indicator list, select your tool, and click "Properties" to change colors, levels, or visual styles.
4. Updating: Replace the old file in the Indicators folder with the new version and restart the platform to apply changes.
Frequently Asked Questions
Q: Why is my indicator not showing? A: Verify the file is in the MQL/Indicators folder, or try right-clicking the "Indicators" tree in the Navigator and clicking "Refresh."
Q: Do custom indicators slow down the platform? A: Too many complex indicators can impact performance; remove unused ones via the "Indicator List" (Ctrl+I).
Q: Can I use MT4 indicators on MT5? A: No, MQL4 and MQL5 are distinct languages; ensure the indicator is compiled specifically for your platform version.
Description & Settings
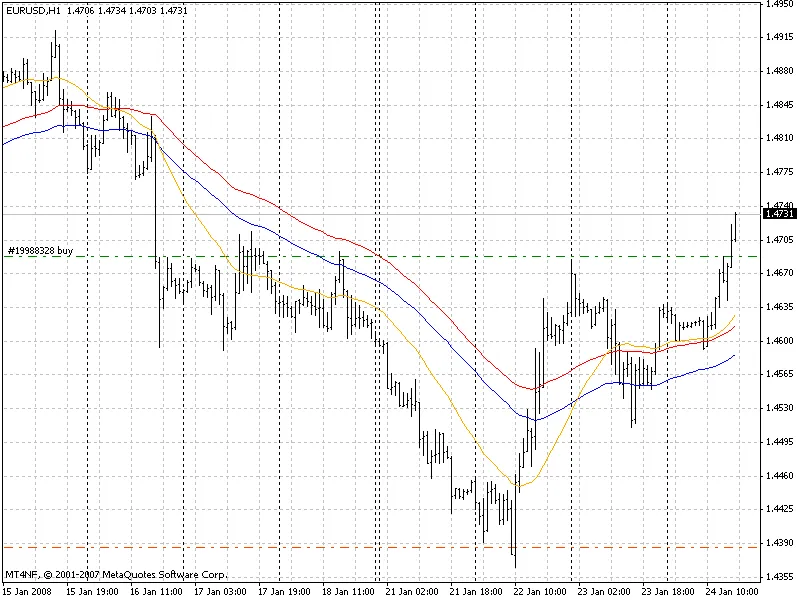
The basis of the indicator is constructing a system combining three MA indicators. Visual presentation and physical sense can be estimated when attaching them to a chart.
The first indicator: SMMA МА of High
The second indicator: SMMA МА of Low
These lines constitute a channel.
The third indicator: LWMA МА of WEIGHTED. Actually this is an impulse signal line. Here is nothing new, but the histogram construction method differs from traditional.
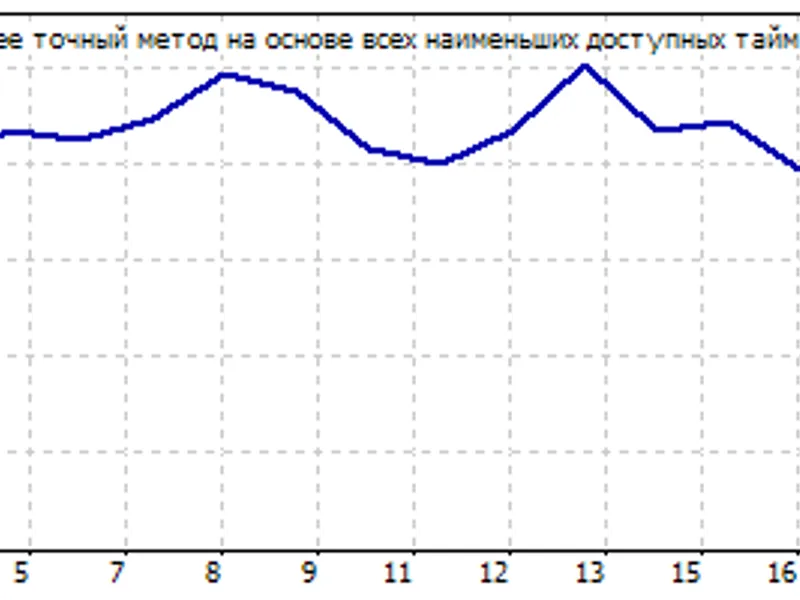
The main question I tried to answer: why do we always need to track MACD values and its movements even if they are useless at the moment? The solution is to remove from a chart all unnecessary values. This is done by analyzing the position of an impulse signal line relatively to the channel lines: if the impulse line is higher than High value, divergence is calculated as the difference between the impulse and the High value. If it is lower than Low, it is calculated as the difference between the impulse and Low. Consequently, intermediary movements are not shown.
And there is additional signal line of a histogram typical of MACD.
A trading system here is clear from the chart: open only when the histogram and the zero line signal cross, if direction changes place a trailing stop and wait for the next intersection if a Stop triggers. So, we use only the first price movement impulse.