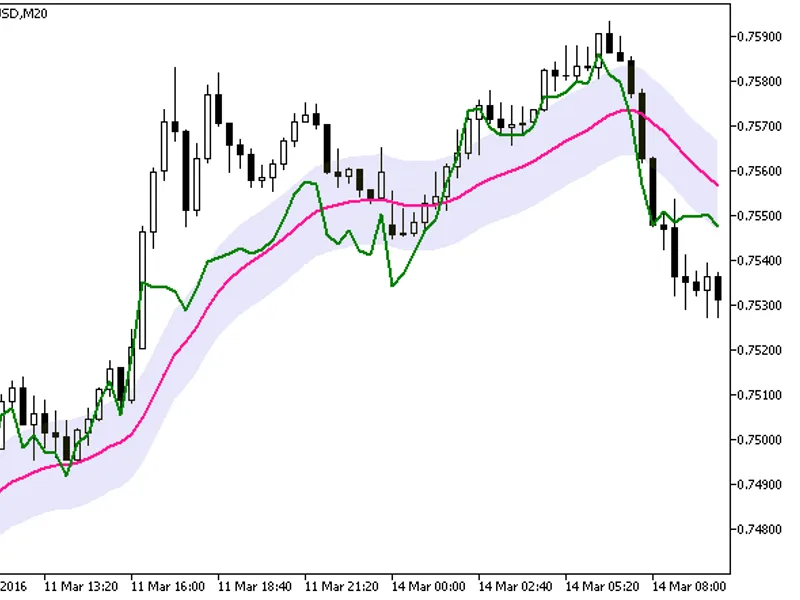
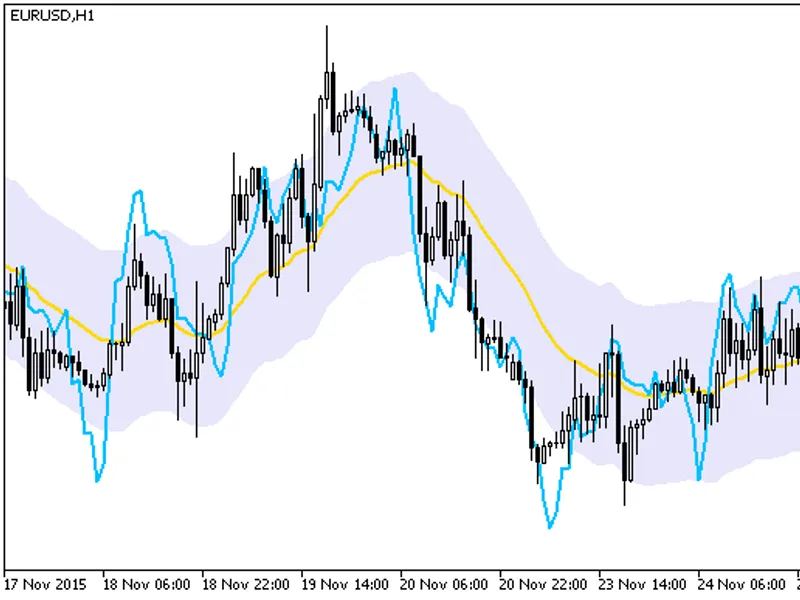
yuriy tokman (ytg)the cci indicator in the main chart window relative to the moving average indicator. the cci indicator is shown in green, the moving average line is red, and the ...
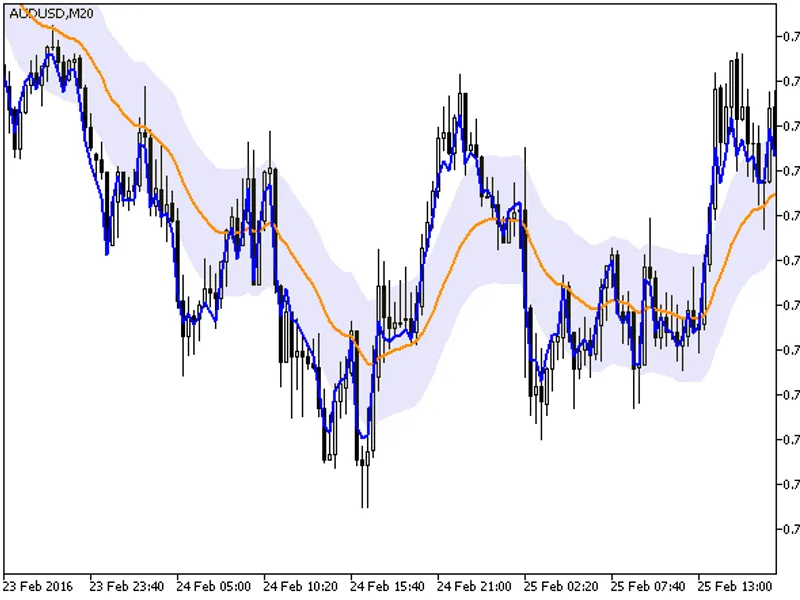
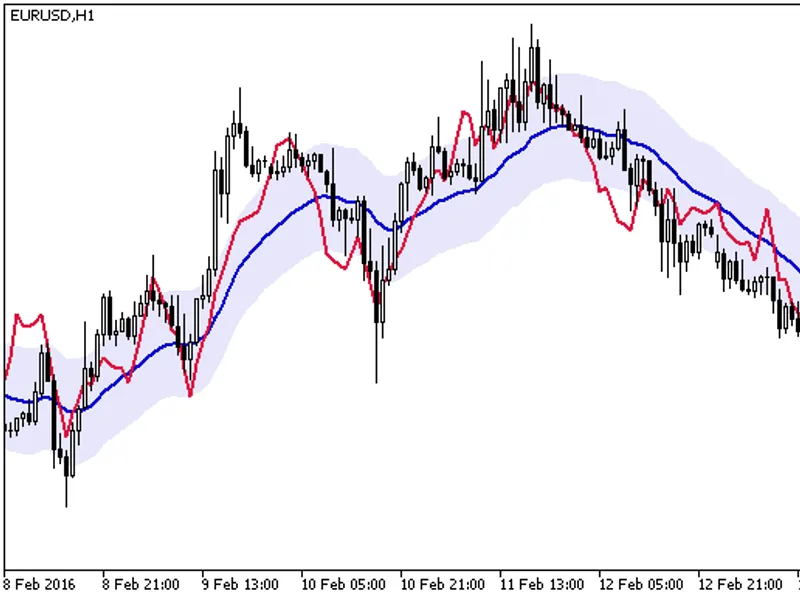
yuriy tokman (ytg)the rsi indicator in the main chart window relative to the moving average indicator. the rsi indicator is shown in blue, the moving average line is orange, and th...
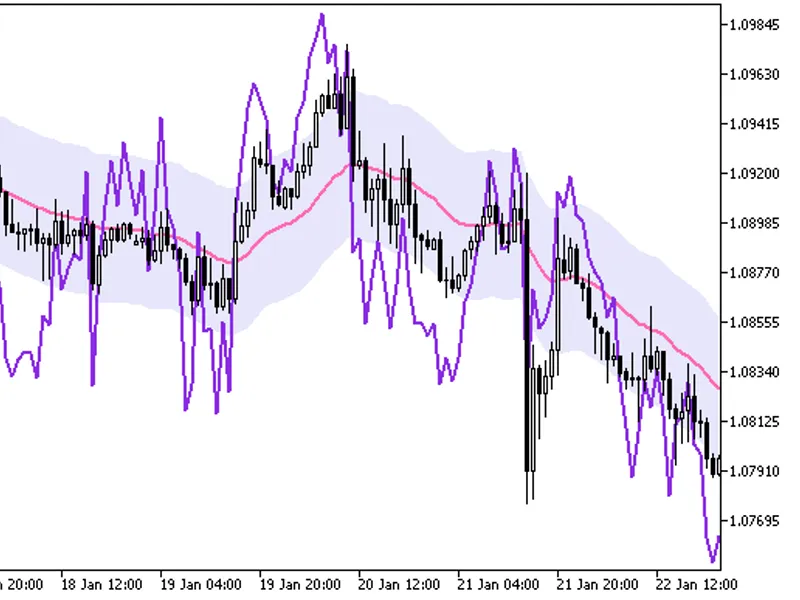
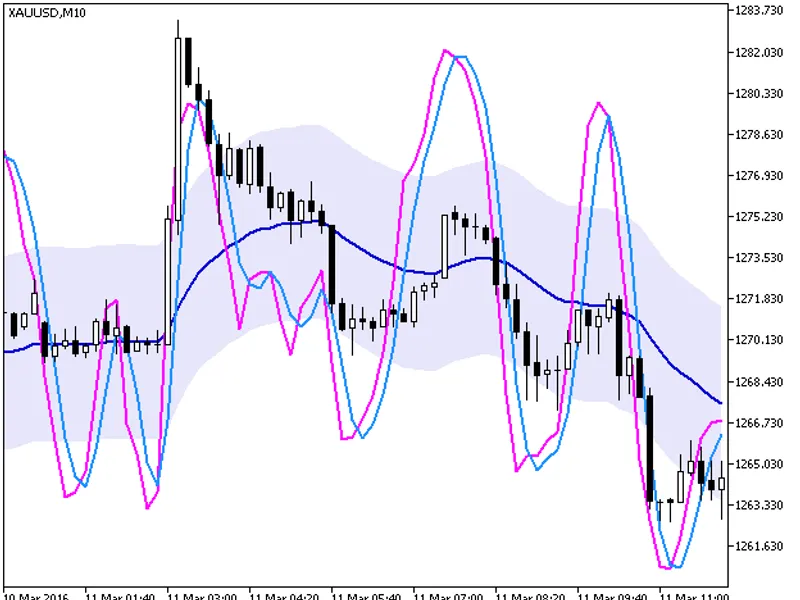
yuriy tokman (ytg)the wpr oscillator in the main chart window relative to the moving average indicator. wrp is shown in purple, the moving average line is pink, and the levels with...
yuriy tokman (ytg)the demarker oscillator in the main chart window relative to the moving average indicator. demarker is shown in blue, the moving average line is yellow, and the l...
yuriy tokman (ytg)the mfi oscillator in the main chart window relative to the moving average indicator. the mfi indicator is shown in blue, the moving average line is dark red, and...
yuriy tokman (ytg)stochastic oscillator in the main chart window relative to the moving average indicator. stochastic is shown in pink, the signal line of stochastic is light blue,...
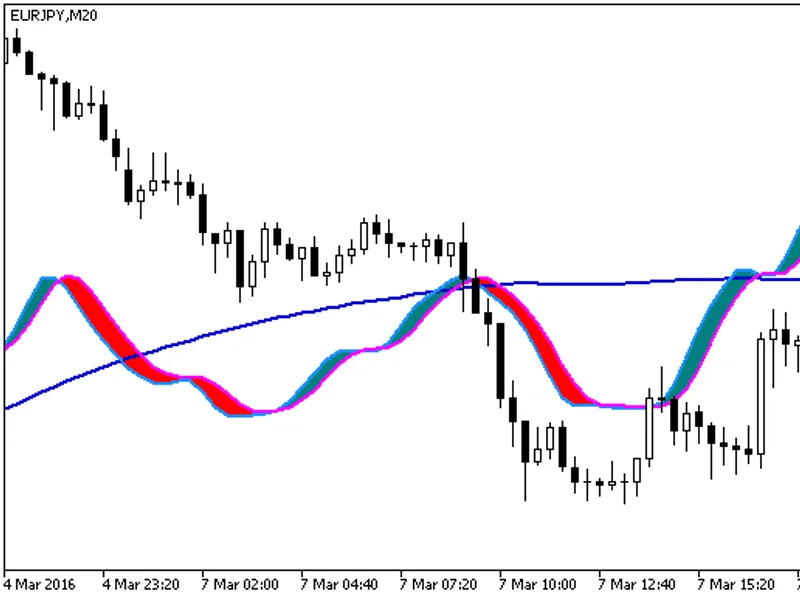
yuriy tokman (ytg)the rvi oscillator in the main chart window relative to the moving average indicator. rvi is drawn as a colored cloud, the moving average is blue.indicator input ...
developed by wilder to improve the ptp indicator and performs two tasks:identifies the long-term trend of the market displays the degree of directivity of a specific market....
the indicator was created as a result of attempts to plot something opposite to the price channel. there are no analogues in the literature (correct me if it is not so, or better p...
as the indicator draws only the number of ticks of the precious candlestick, it will not display the results of its operation immediately.at all. for those who work level breakouts...
useful for those who use the demark td lines in trading. it draws td points, plots td lines, calculates the current values of td lines, calculates the targets.ind-td-demark-3-1para...
the second indicator of the series of simple indicators without averaging.the meaning of the indicator is quite clear from its code. instead of analyzing the period, a fixed channe...
the mathematical formula expressing the linear regression looks the following way: у = а + bx, where: у - close price; х - position of the current time period in the database; а - ...
i guess i am not the only one who has difficulties with making decisions when interpreting the ichimoku values. the main idea if the formalization of the ichimoku signals and ident...
quote:details on its usage.attach three indicators to the chart (adxcross, nduet and surovny)the first two place entry arrows at the interval of 1-2 bars from each other- this is a...
roshthis is an attempt to write a trend indicator based on the kaufman's ama. the indicator available in the code base can be used as the "kaufman2" custom indicator.when started t...