Candlestick Gain/Loss Analysis ToolThis indicator displays the current gain and loss for all candlesticks that exceed a specified threshold. Values are calculated in both percentag...
Price Alert Indicator
This indicator plays sound alerts when the price reaches specific levels defined by the trader. It supports three types of alerts:
1. Price rises above a sp...
This indicator displays the length of trend lines in points.It adds information, specifically the number of points, to all trend lines currently on the chart or those that are abou...
The Trade Breakout indicator reveals the distance from the actual price (close or maximum/minimum prices) to recently established support or resistance levels. These levels are def...
This indicator displays the balance and equity lines on your trading chart. It also offers the option to visualize the used margin as a histogram and free equity as an additional l...
The Super Trend indicator not only determines the trend direction, but also helps to detect Elliott Waves.
Elliott Wave Theory is a form of technical analysis used to analyze finan...
The Regression Channel indicator plots a linear regression channel. Initially, the indicator draws a trend line between two points. Based on this trend line, it plots a channel con...
The Triple Exponential Moving Average (TEMA) technical indicator was developed by Patrick Malloy. It was published in the Technical Analysis of Stocks & Commodities journal in 2026...
In certain situations, it is necessary to display quotes from another financial instrument (symbol) or timeframe within the current chart window. An example of this need is to show...
This indicator demonstrates the creation of customizable information panels.The size of the displayed rectangle dynamically adjusts to fit the enclosed text.This allows for flexibl...
This indicator displays the number of times supply and demand zones have been retested.It identifies zones that have transitioned from support to resistance, and vice versa.The ind...
RSI Indicator with Dynamic LevelsThis indicator enhances the traditional Relative Strength Index (RSI) by incorporating dynamic levels, providing a more adaptive trading tool.Indic...
This indicator displays Heiken Ashi candlesticks with high precision in a separate subwindow.It facilitates navigation without cluttering the main chart.Users can customize the col...
The Subway indicator displays a price channel based on moving averages.Indicator Settings:level_model - Defines the channel line layout model relative to the central line in points...
The Channels Fibo indicator effectively resolves the issue of redrawing and significantly increases the speed of indicator value calculation.The core concept of the indicator invol...
This indicator plots a trading channel based on fractal points.Indicator Settings:time_frame: Specifies the chart period for identifying fractals and channel control points. A valu...
This indicator utilizes data from three distinct stochastic oscillators to identify potential trading entry points.The three stochastic oscillators included are:- Slow Stochastic (...
This indicator highlights bars that exceed a specified size, considering the bar's body, opening price, and closing price.Indicator Settings:bars_size - Minimum bar size in points....
Fibonacci Channels Indicator for MetaTrader 4/5.
This indicator displays Fibonacci channels on your chart.
Limitation: The current chart period cannot be higher than the value sp...
The indicator values are displayed only when new ticks appear. The indicator does not display history.Indicator Settings:symbol_1 = "eurusd"; — Name of the first symbol to display....
This indicator displays three sets of Bollinger Bands on the chart.The default standard deviation settings are 2, 3, and 4.The indicator has been modified to allow full customizati...
A bulls power indicator with options for price type selection (open, close, high, low) for histogram calculation. The indicator also features smoothing of the resulting histogram.T...
A customizable Bears Power indicator presented as a colored histogram.Users can select the price type (Open, Close, High, Low) for calculation.The indicator incorporates smoothing ...
The indicator is implemented as a sequence of candlesticks. Candlesticks appear as a result of relevant price timeseries processed by the ColorBears indicator algorithm.In many sit...
The indicator is implemented as a sequence of candlesticks.
Candlesticks appear as a result of the relevant price timeseries processed by the ColorBulls indicator algorithm.
In man...
An unnormalized oscillator used as a trend identifier. The oscillator color changes serve as signals for opening positions.The indicator utilizes classes from the smoothalgorithms....
Volatility Quality HTF IndicatorThis indicator includes a timeframe selection option in its input parameters.The indicator requires the volatilityquality.mq5 indicator file. Please...
The indicator displays price gaps on the candlestick chart. These gaps often signal a continuation of short-term price trends.A new bar on the indicator's histogram appears only wh...
The indicator displays price gaps on the candlestick chart. These gaps often signal a continuation of short-term price trends. A new bar on the indicator's histogram appears when f...
The Color Bears HTF indicator includes a timeframe selection option in its input parameters.This indicator requires the colorbears.mq5 indicator file. Ensure this file is placed in...
The Color Bulls HTF indicator is a tool that allows for timeframe selection through its input parameters.To use this indicator, the colorbulls.mq5 indicator file must be present in...
Semaphore signal indicator based on a specific indicator algorithm.The indicator utilizes classes from the smoothalgorithms.mqh library. Ensure this library is copied to your \mql5...
The Le Bon Trend Signal Indicator is a trading tool that provides trend signals based on a specific algorithm.This indicator utilizes classes from the smoothalgorithms.mqh library....
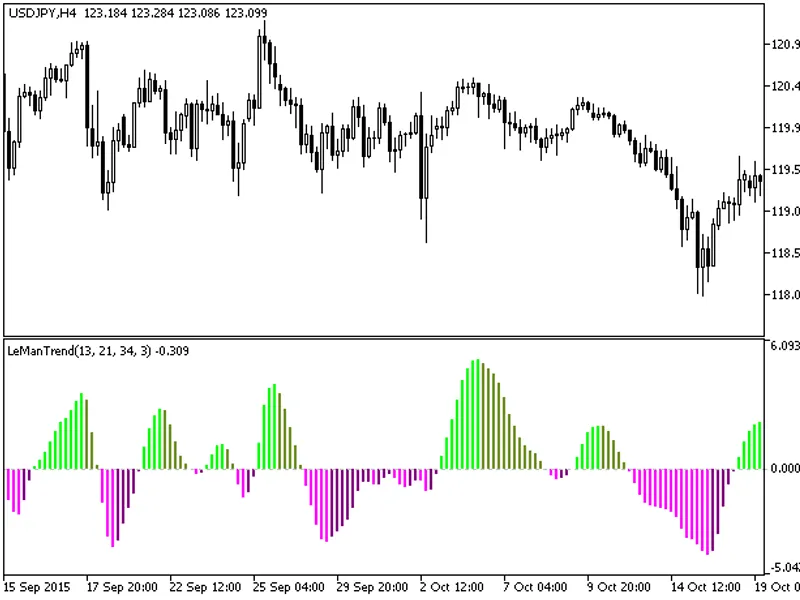
The Le Man Trend Indicator is implemented as a histogram that visualizes the smoothed difference between its signal lines.The indicator utilizes classes from the "smoothalgorithms....
Le Man Trend History Indicator provides trend analysis using historical data.
Features: - Timeframe selection option available in input parameters.Prerequisites: - Requires the lem...
VK Bands Modify Candle Indicator displays price data as a series of candlesticks.These candlesticks are generated by applying the vkw_bands_modify indicator algorithm to the price ...
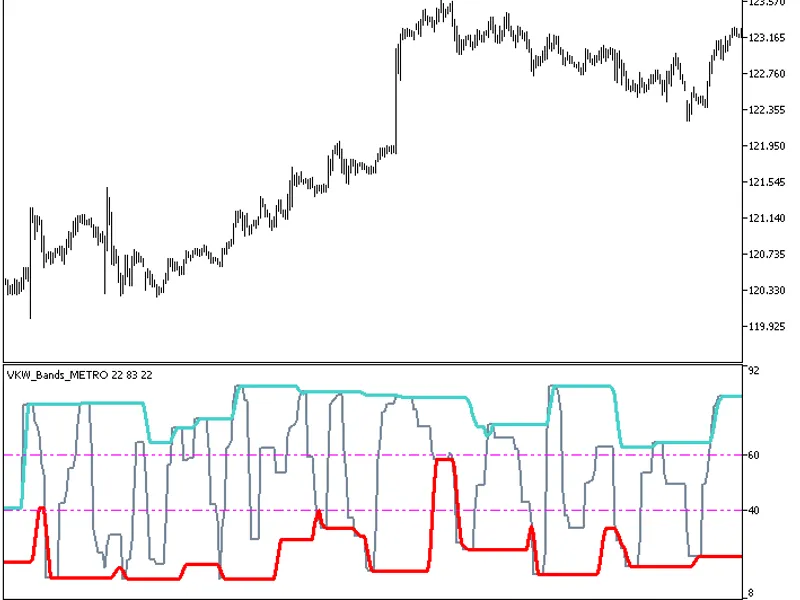
VK Bands Modify DeMarker IndicatorThis indicator helps determine optimal times for placing pending orders using an oscillator.The thick pink and red lines represent the channel bor...
VK W Bands Modify De Marker HTF IndicatorThis indicator includes a timeframe selection option in its input parameters.The indicator requires the colormetro_demarker.mq5 and vkw_ban...
Key improvements include the plotting of compression values (with some changes in the calculation of Bollinger Bands/Keltner Channels) on the zero line, and then smoothing the mome...
Semaphore Signal Indicator based on the indicator intersection algorithm.3D Oscillator Signal IndicatorThis indicator utilizes the intersection of signals to generate trading oppor...
Squeeze RA HTF Indicator with Timeframe SelectionThis indicator includes a timeframe selection option available in the input parameters.The indicator requires the squeeze_ra_v1.mq5...
ColorMe XRSx Indicator
This is an oscillator-type indicator that displays its values based on the technical indicator XRSx.
The XRSx indicator is represented by a blue line. The ...
Color Meter XRSX HTF Indicator with timeframe selection option.This indicator requires the XRSX.mq5 and ColorMetro_XRSX.mq5 indicator files. Please place these files in the termina...
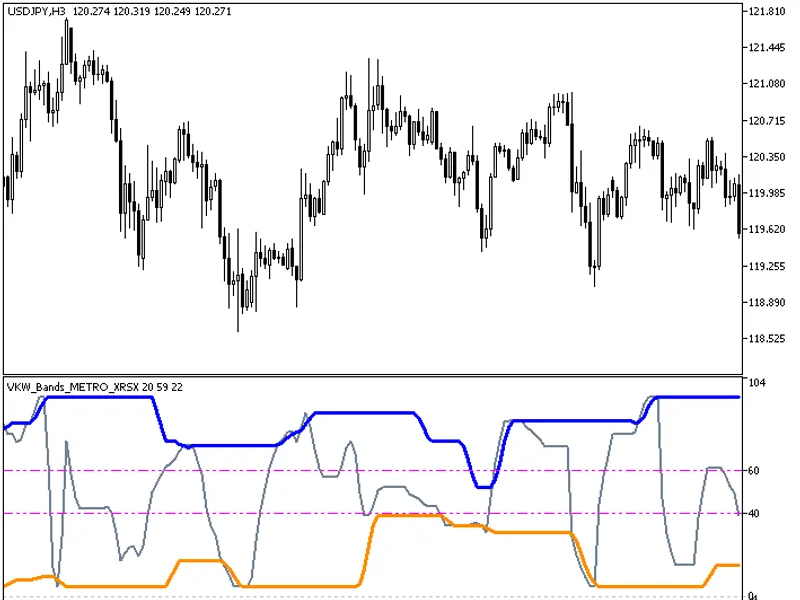
VK Bands Modify XR S XThis indicator helps determine optimal times for placing pending orders using an oscillator.Thick blue and red lines define the channel borders.The optimal ti...
VK Bands Modify XR S X HTF IndicatorThis indicator offers a timeframe selection option in its input parameters.The indicator requires the following files: xrsx.ex5, colormetro_xrsx...