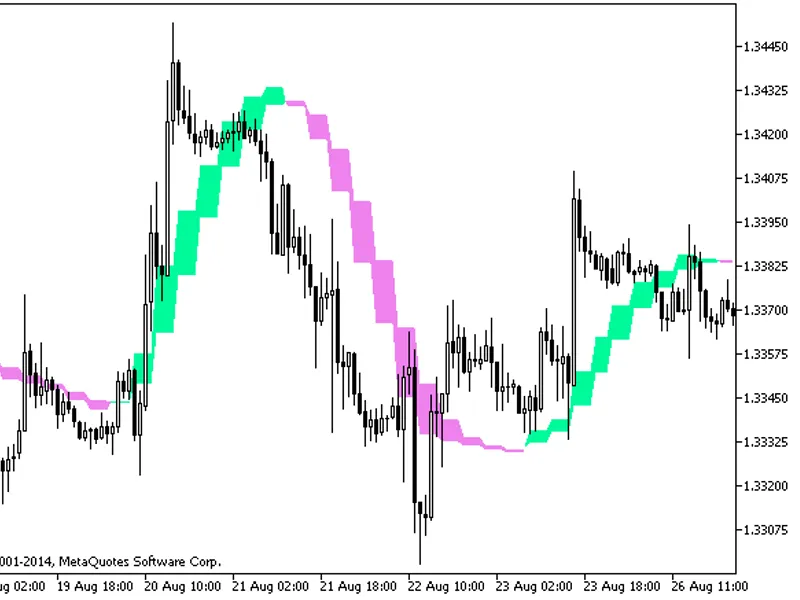
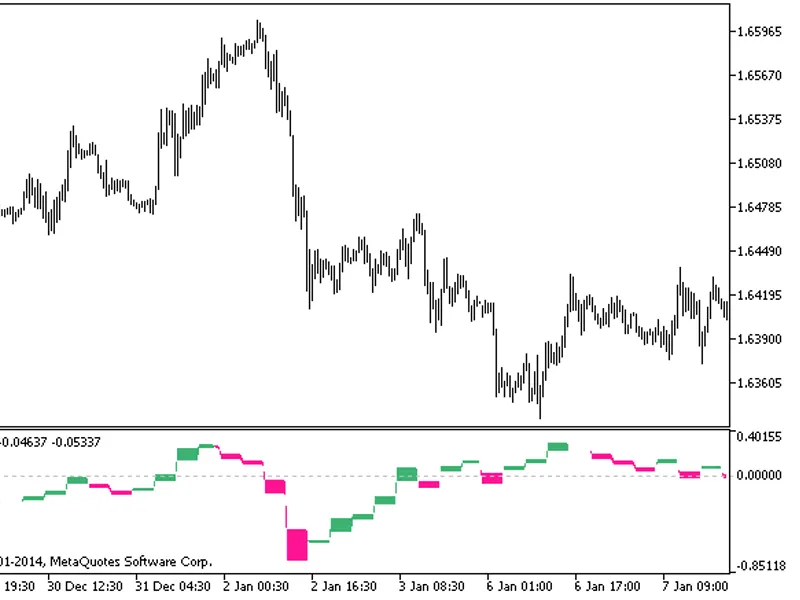
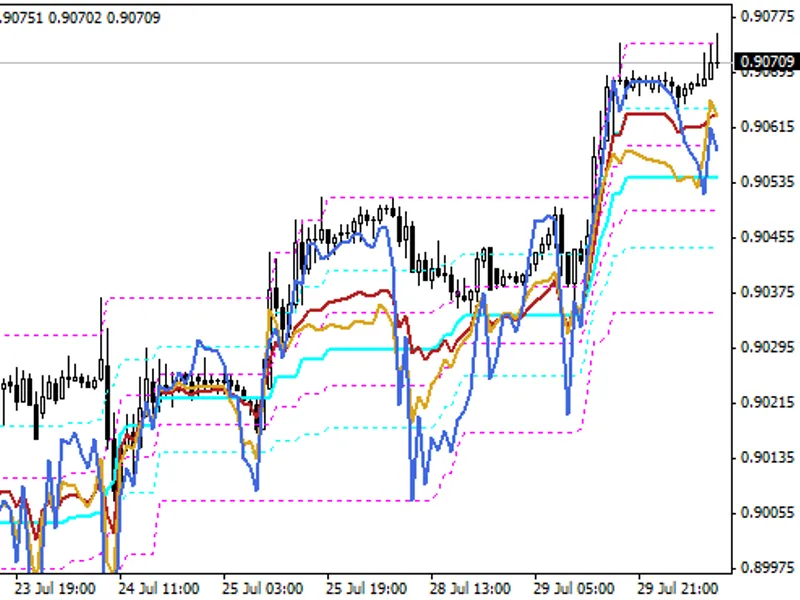
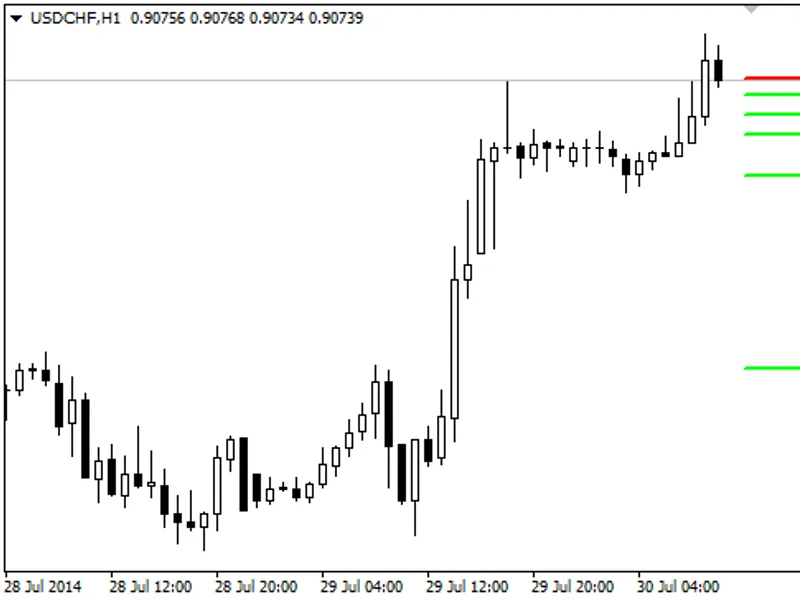
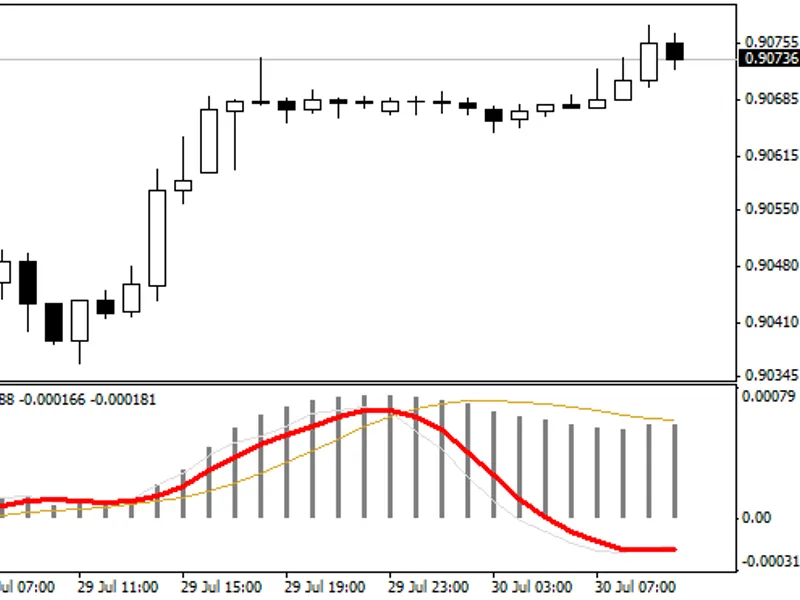
Hull Trend Indicator with Timeframe SelectionThis indicator includes a timeframe selection option directly within its input parameters. You can set the desired timeframe using the ...
Introduction to NRatio Indicator.OverviewThe NRatio indicator is a tool used for analysis. For details, see the provided information.The indicator utilizes classes from the SmoothA...
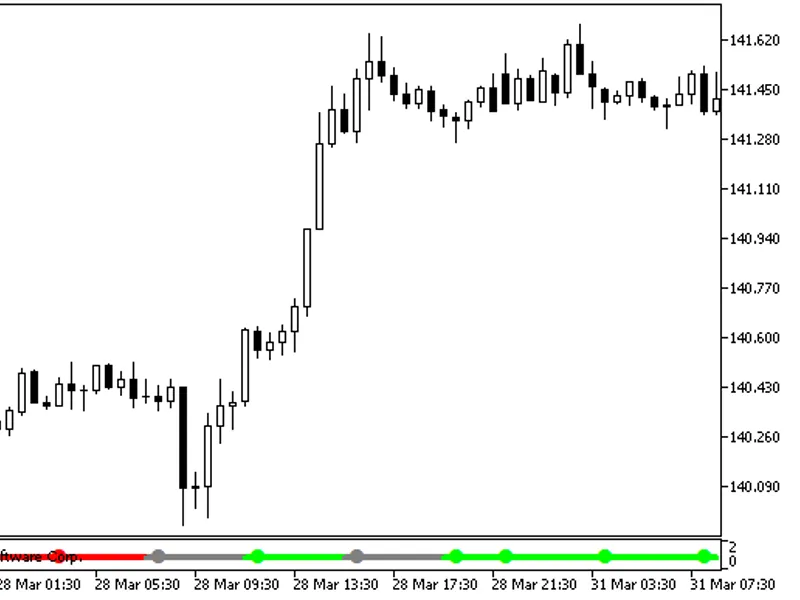
The AMK Signal indicator displays information on the current trend using the values of the indicator with a fixed timeframe.The indicator shows signals from the colored dots of the...
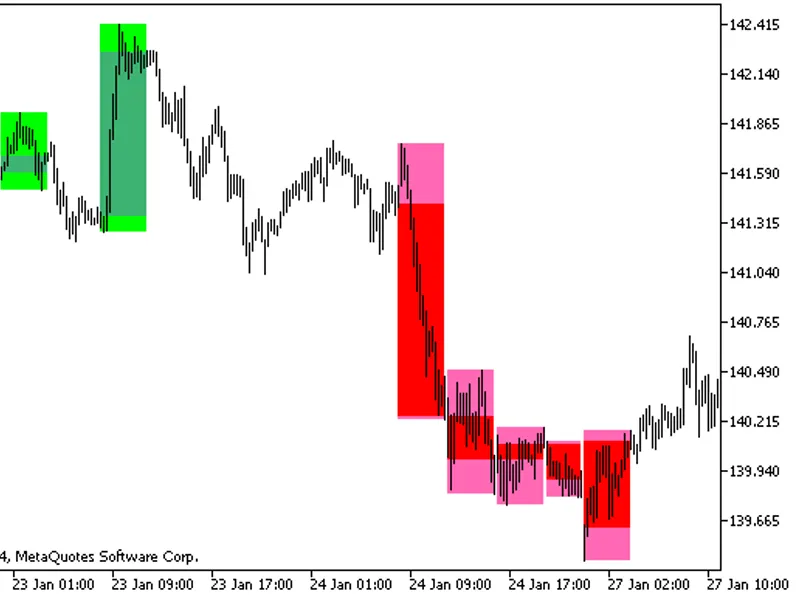
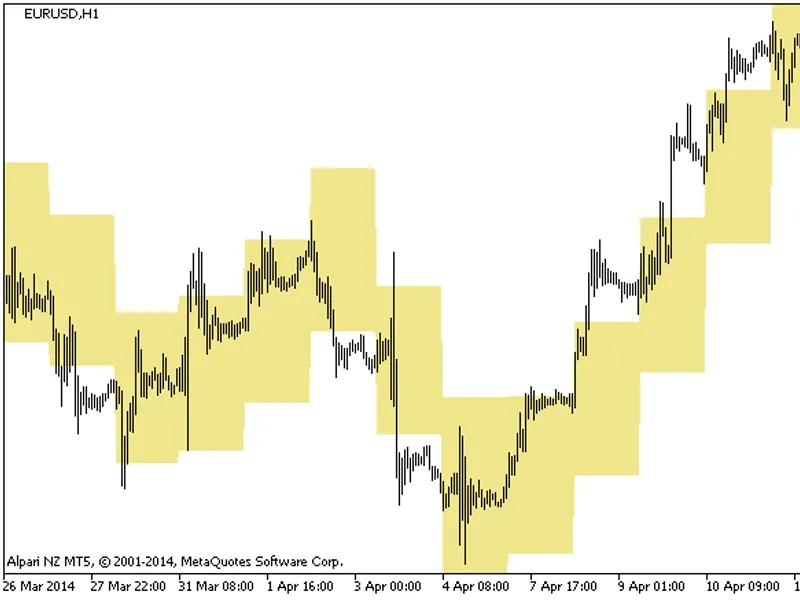
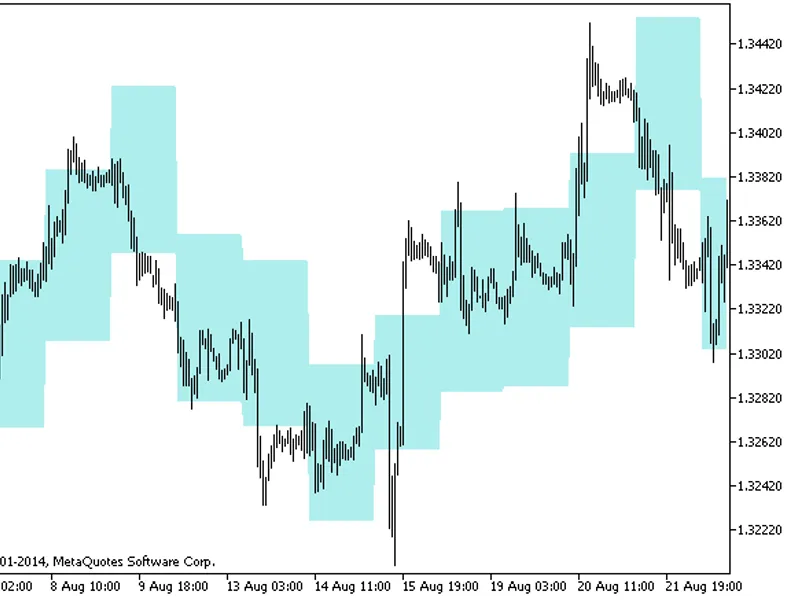
The indicator draws candlesticks of a larger timeframe as color filled rectangles using buffers. Rectangles are color filled in accordance with the colors of the indicator dots, if...
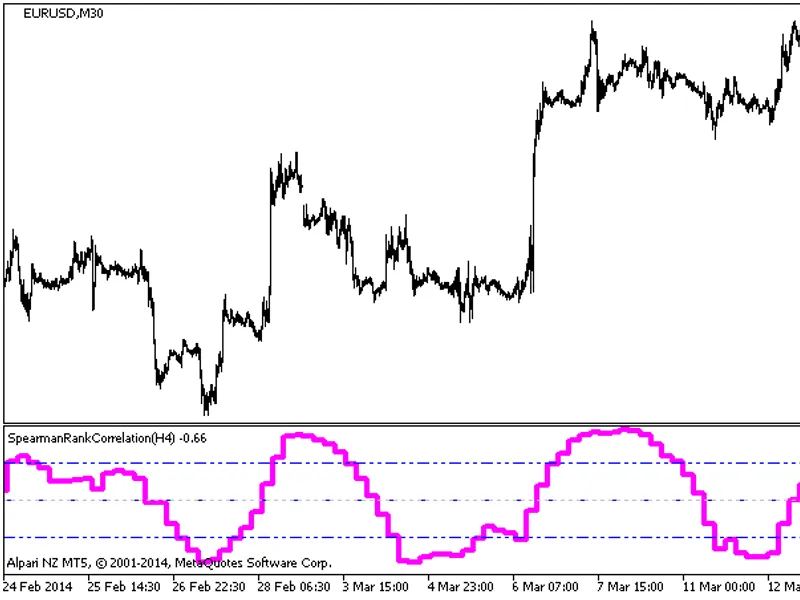
Spearman Rank Correlation Indicator with Timeframe SelectionThis indicator includes a timeframe selection option within its input parameters.To ensure correct operation, please pla...
Relative Vigor Index with Flat Market State Detection Option.When the market is in a flat state, the colored indicator cloud will shrink and position itself at the 0 level. A thick...
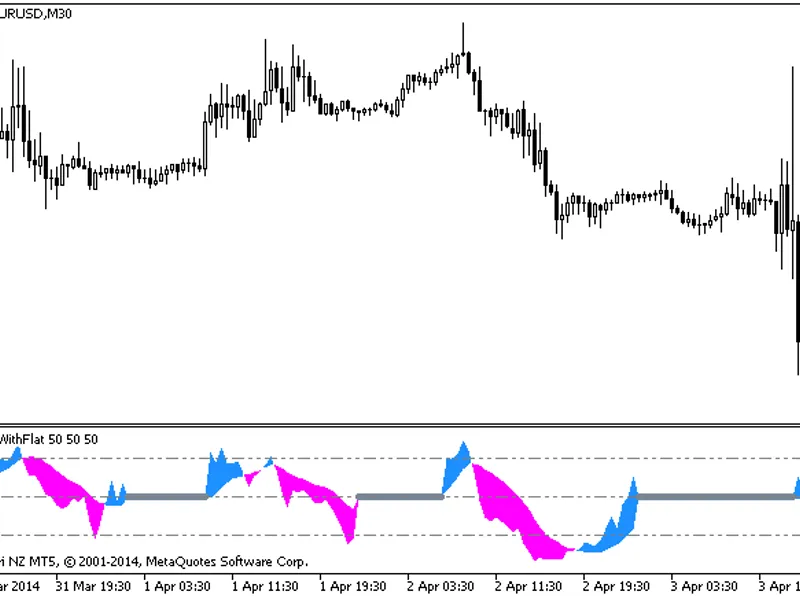
Money Flow Index with Flat Market State Detection Option.When the market is flat, the colored indicator cloud shrinks and is positioned at the value of 50. A thick gray line appear...
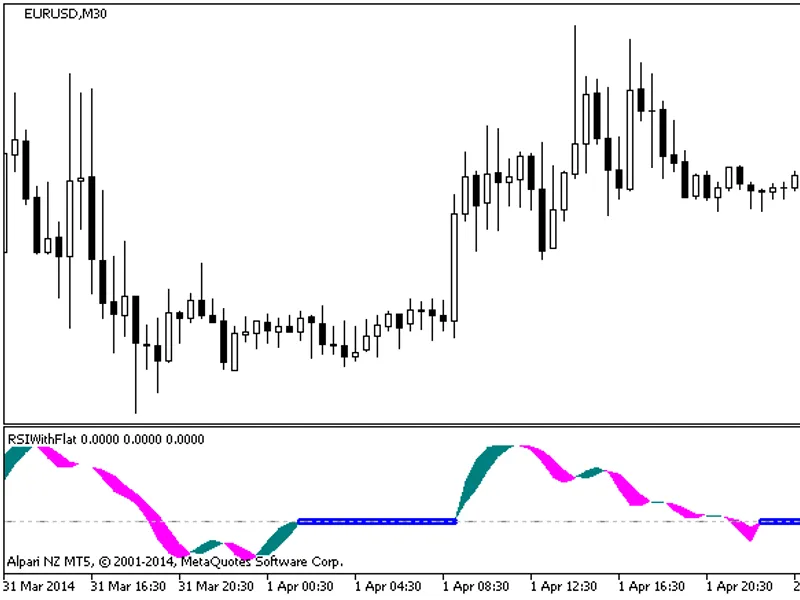
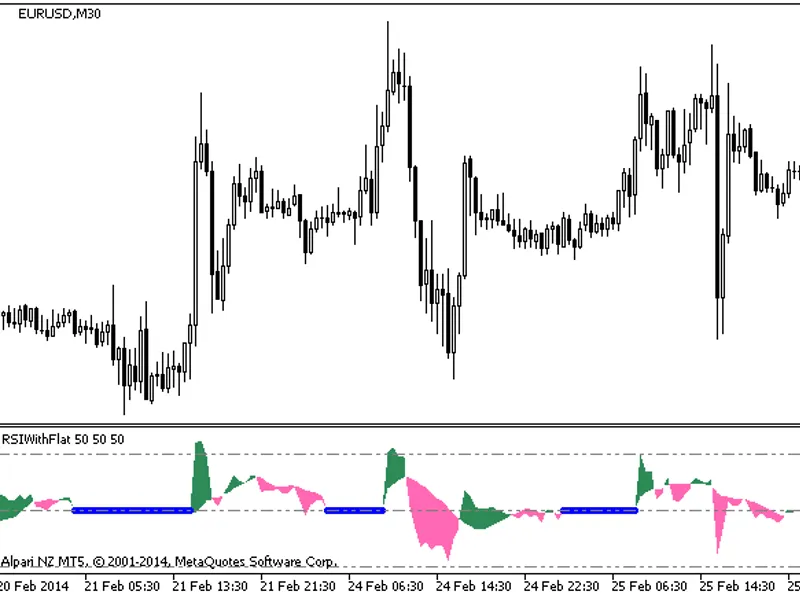
Relative Strength Index with Market Flat State Detection Option.When the market is flat, the indicator cloud shrinks and is positioned at the value of 50, accompanied by a thick bl...
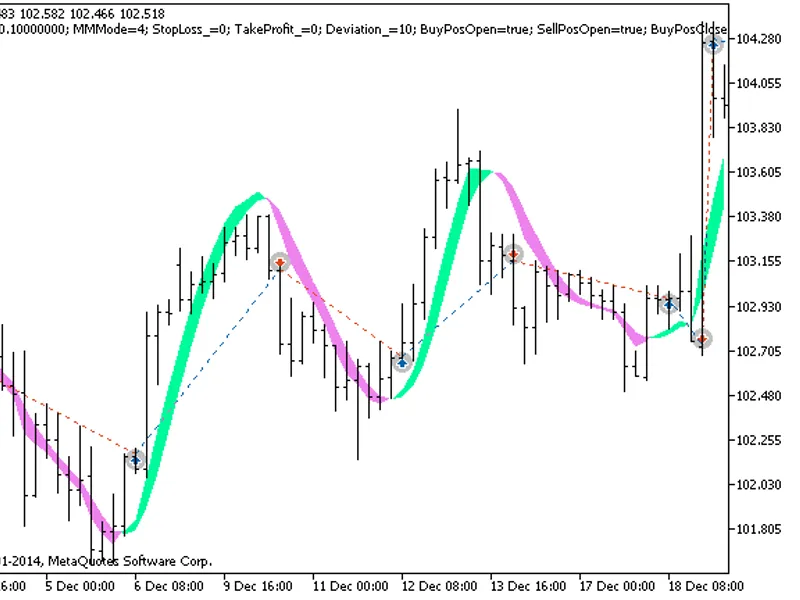
The Exp Hull Trend Expert Advisor utilizes signals from the Hull Trend indicator.A signal is generated when the indicator's cloud color changes upon a bar's close.For proper functi...
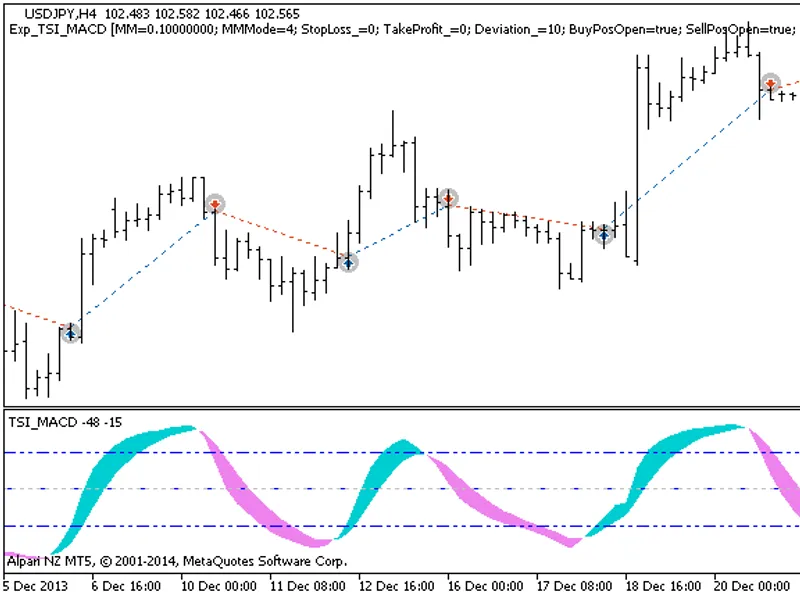
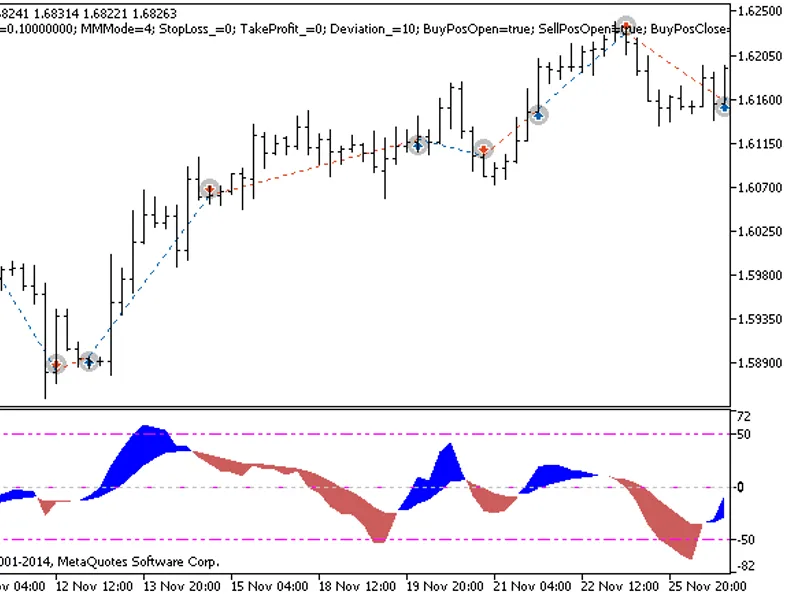
The EXP Cronex RSI Expert Advisor utilizes signals from the TSI MACD oscillator.
A signal is generated upon the closing of a bar if the indicator's cloud color changes.
For proper ...
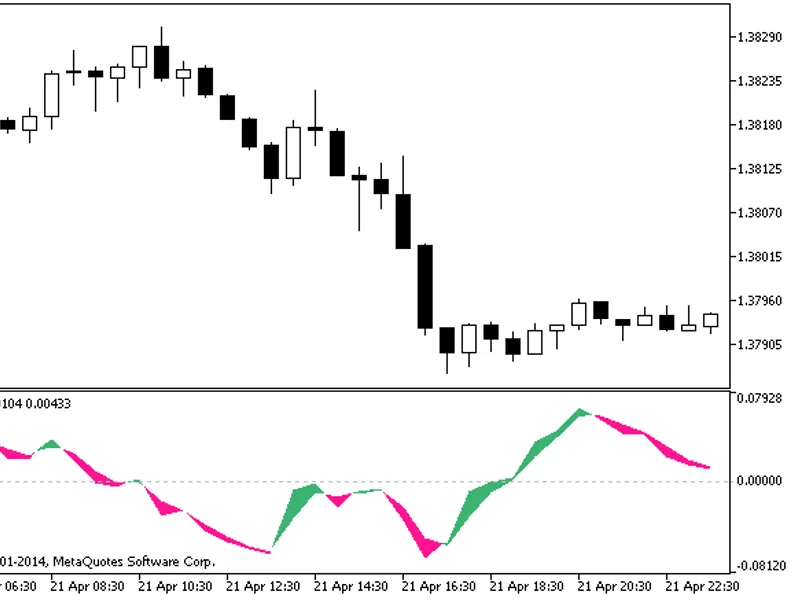
The EXP TSI CCI Expert Advisor utilizes signals from the TSI_CCI oscillator.A signal is generated when the indicator's cloud color changes upon bar close.For proper functioning, en...
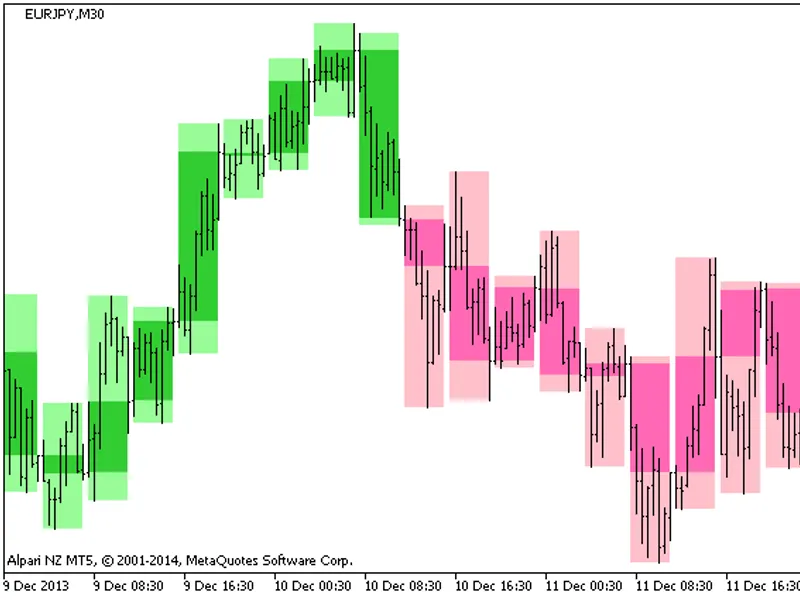
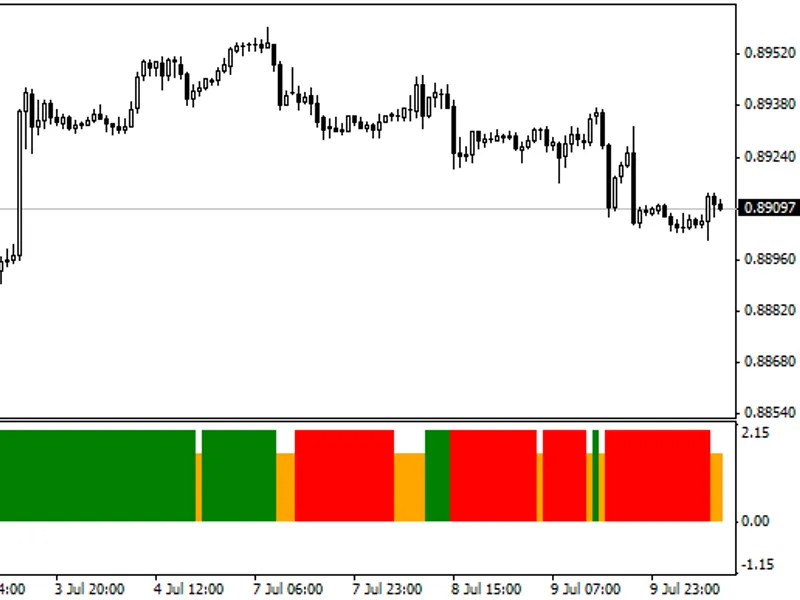
This indicator displays larger timeframe candlesticks as color-filled rectangles. The color of these rectangles is determined by the Hull Trend indicator values.
When the trend i...
The TSI WPR indicator is a trading tool for MetaTrader platforms.It combines the True Strength Index (TSI) and the Williams Percent Range (WPR) oscillators.This indicator is design...
RD-Forecast OscillatorA non-normalized oscillator utilizing Tilman's averaging method, displayed as a color cloud.The original indicator was developed in MQL4 and published in the ...
CC MX IndicatorA non-normalized indicator that utilizes MACD, CCI, and ADX for its calculations.The original indicator was developed in the MQL4 language and published in the Codeb...
This section discusses the concept of inverse reaction.It is important to understand how reactions can proceed in the opposite direction.Further details on the mechanisms and condi...
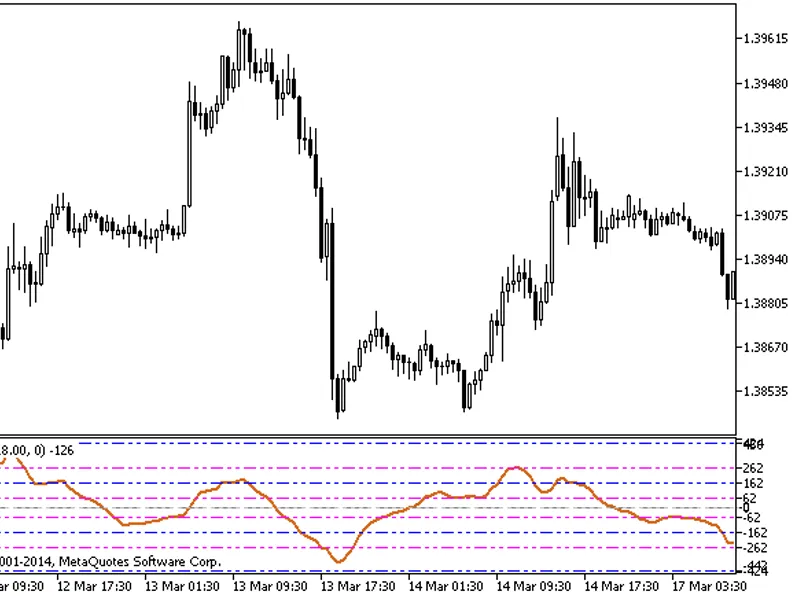
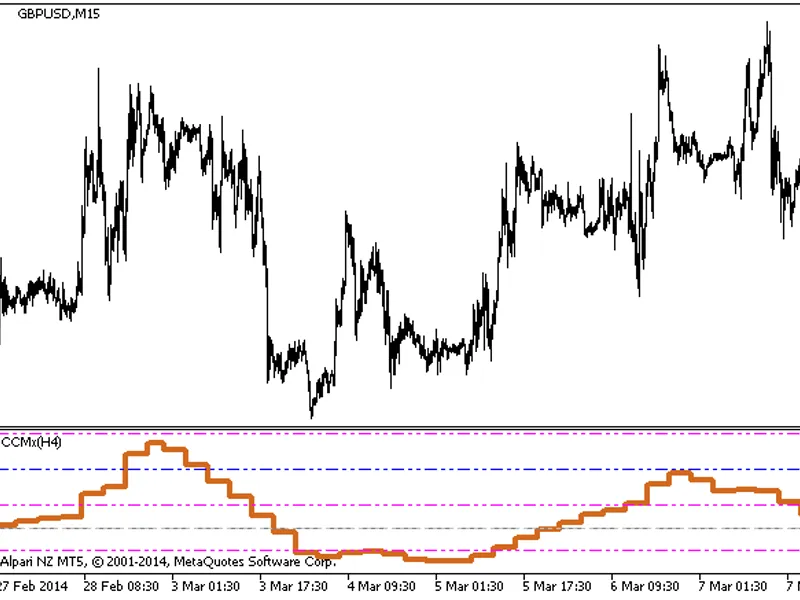
CCMX HTF Indicator with Timeframe SelectionThis indicator, CCMX, includes an option for timeframe selection within its input parameters.Input Parameter:enum_timeframes timeframe = ...
RD-Forecast OSC HTF IndicatorThe RD-Forecast OSC HTF indicator includes an option to select the timeframe directly within the input parameters.Input Parameter:enum_timeframes timef...
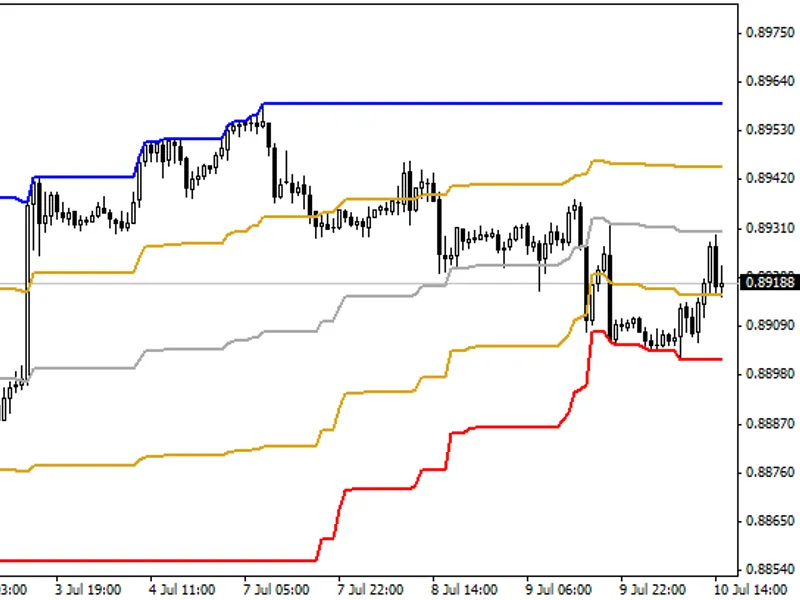
SR Cloud IndicatorThis indicator calculates potential resistance and support levels based on historical price volatility around the bar's open price.The core idea is to add a value...
SRM Cloud IndicatorThis indicator calculates dynamic support and resistance levels based on bar open prices, average minimum swings, and standard deviation. It adapts to market vol...
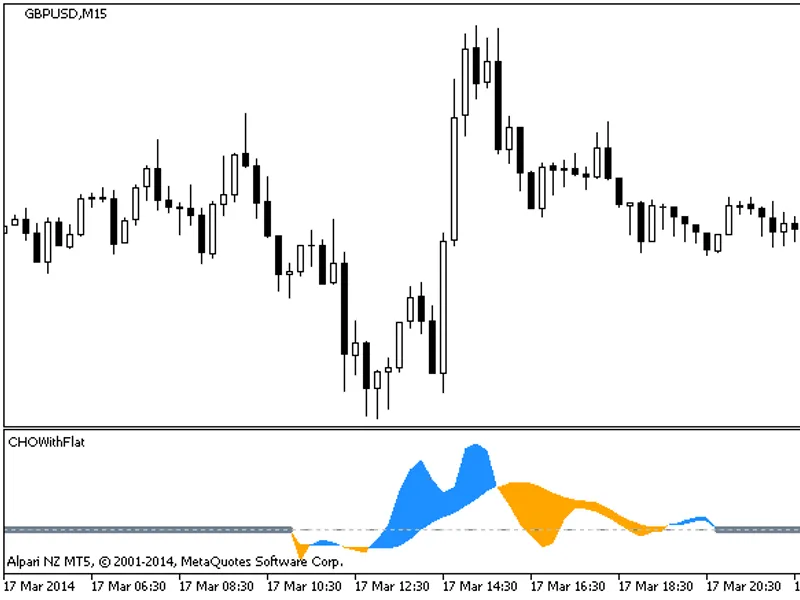
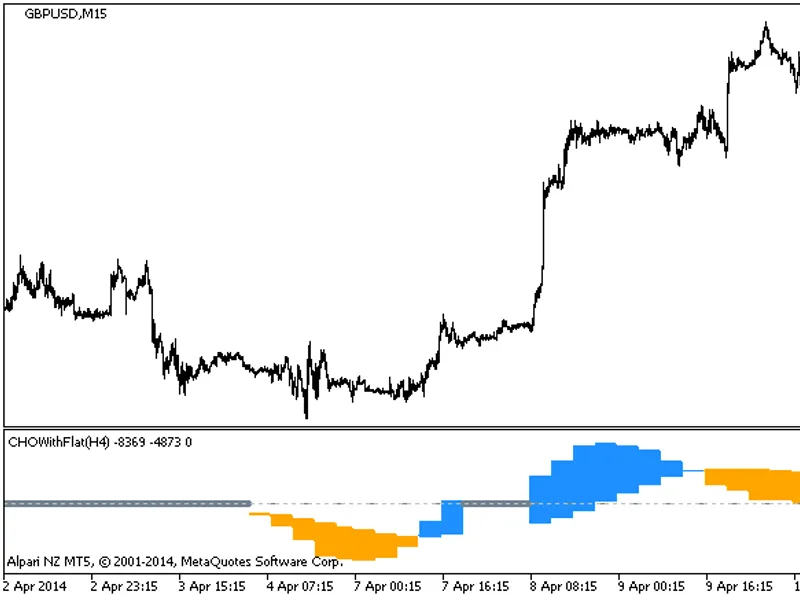
CHOWithFlat Indicator with Higher Timeframe (HTF) OptionThe CHOWithFlat indicator includes a timeframe selection option directly within its input parameters.Input Parameter Example...
RVI Indicator with Higher Timeframe SelectionThe RVIwithFlat indicator includes a timeframe selection option within its input parameters.Inputenum_timeframes timeframe = period_h4;...
The RSI with Flat indicator offers a timeframe selection option within its input parameters.Example Input:enum_timeframes timeframe = period_h4;// Indicator chart period (timeframe...
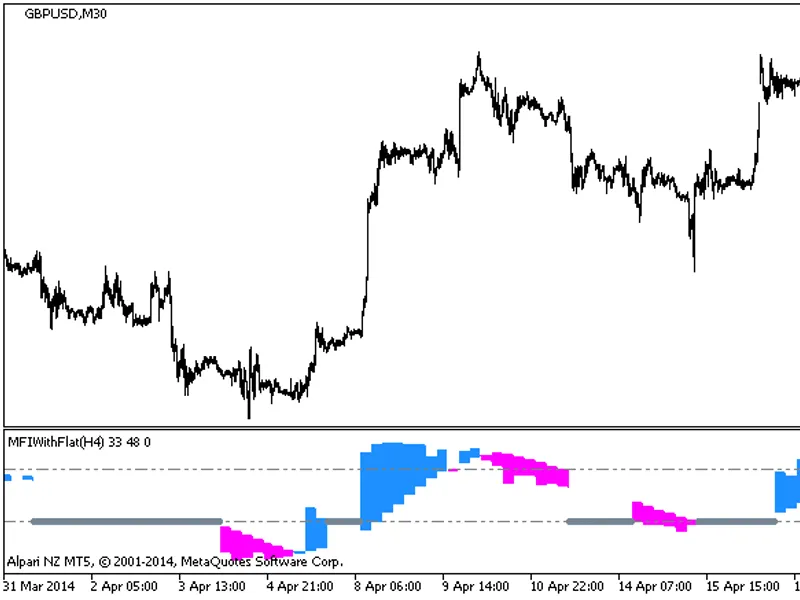
MFI Indicator with Flat Higher Timeframe AnalysisThis indicator provides Money Flow Index (MFI) analysis with the flexibility to select a higher timeframe directly within the input...
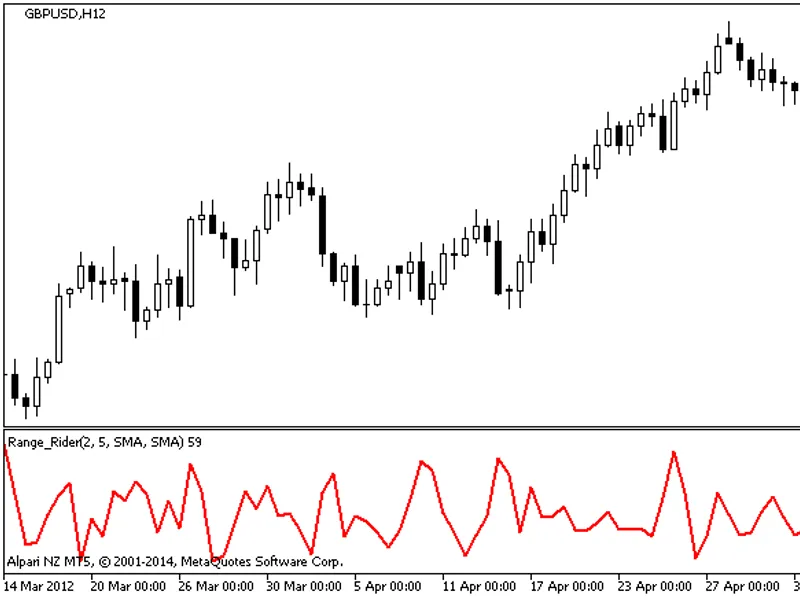
The Range Rider indicator is a technical analysis tool designed to help traders identify potential trading opportunities within defined price ranges.This indicator analyzes price a...
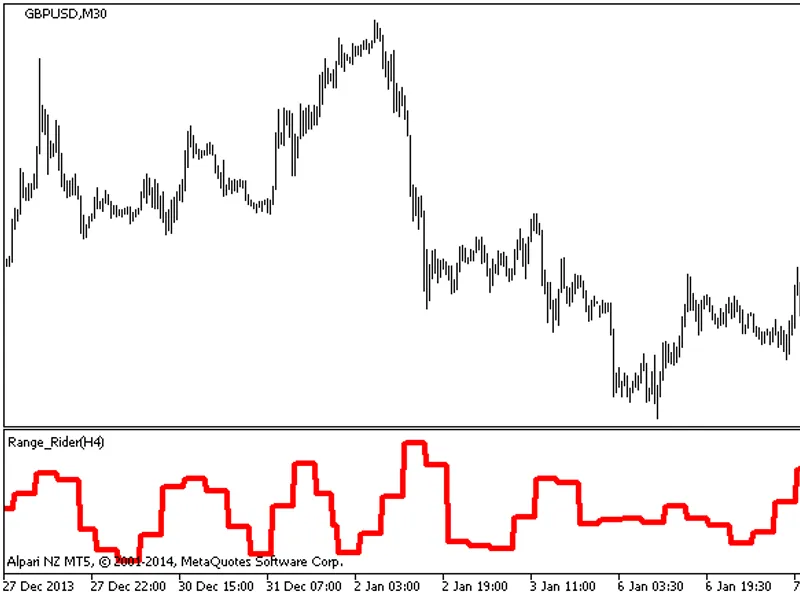
The Range Rider indicator with the timeframe selection option available in input parameters:
This indicator allows for the selection of the timeframe.
To provide correct operation ...
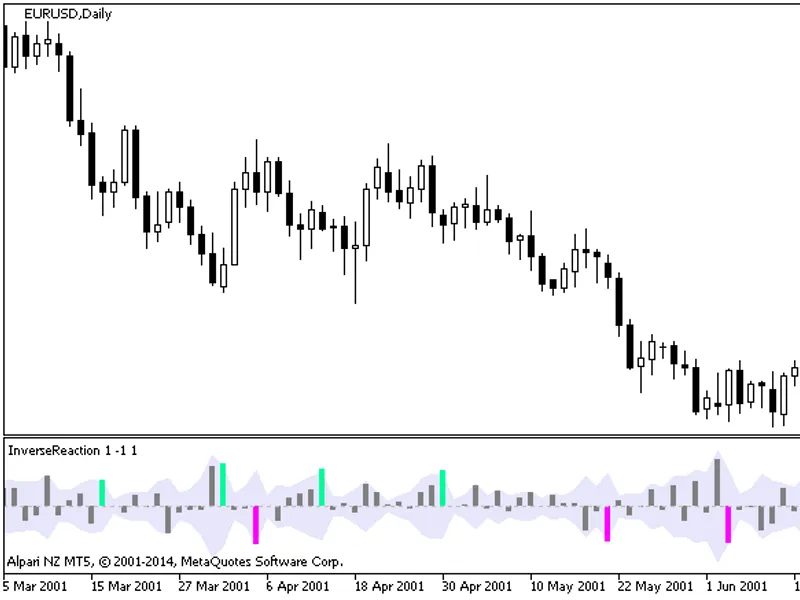
Inverse Reaction HTF Indicator with Timeframe SelectionThe Inverse Reaction indicator now includes a timeframe selection option directly within the input parameters.Input Parameter...
An Expert Advisor that utilizes the Parabolic SAR indicator to identify buy and sell signals.
It automatically manages open positions to secure profits.Key Features:- Utilizes Para...
Profit Trailing Expert Advisor
This Expert Advisor (EA) implements virtual profit trailing to manage trades.
Parameters:
minlots: The minimum lot size for calculation. Typically...
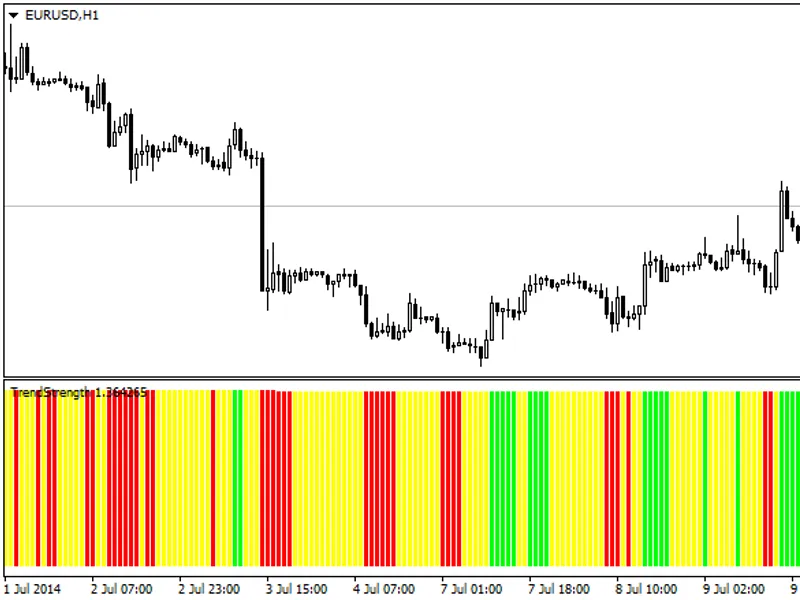
Trend Strength IndicatorThis indicator utilizes a 5-period simple moving average to identify market trends. It displays green bars for uptrends, red bars for downtrends, and yellow...
Triple Exponential Moving Average Crossover Indicator.The indicator requires maperiod1 to be smaller than maperiod2, and maperiod2 to be smaller than maperiod3.The indicator displa...
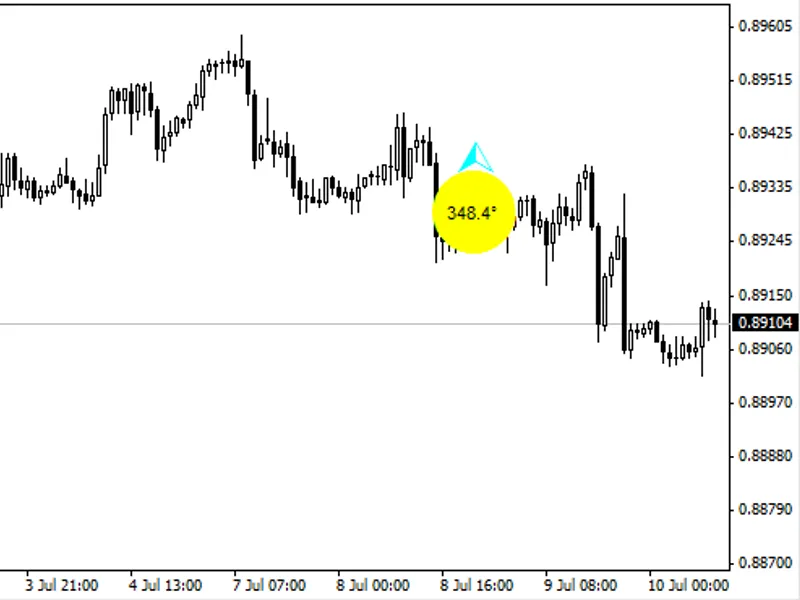
Price Degrees Indicator displays the current price position in degrees relative to the trend status on the active timeframe. It provides alerts when the price position or trend con...
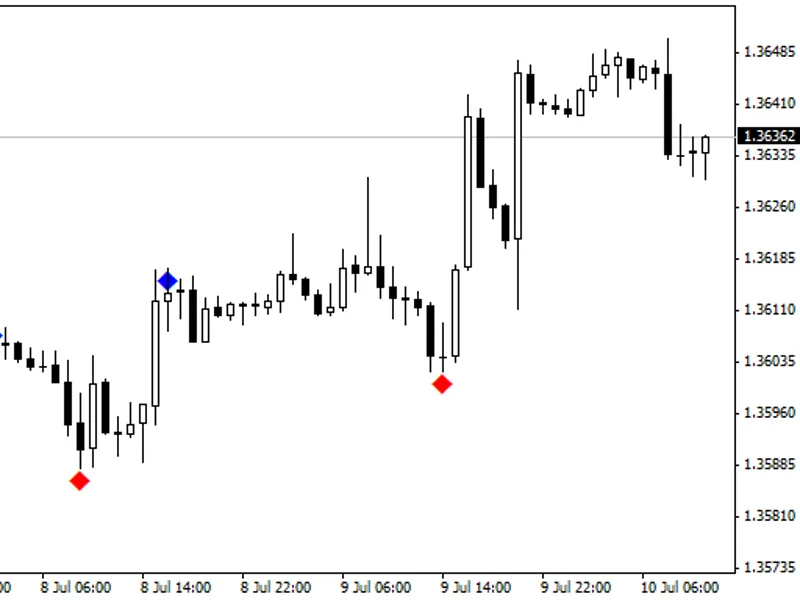
This script identifies and displays peaks and valleys within a specified period.The indicator visually marks these significant turning points on the price chart, helping traders to...
This indicator calculates and displays the highest, lowest, and median price points over a specified period.The indicator plots these three key price levels directly on your chart,...
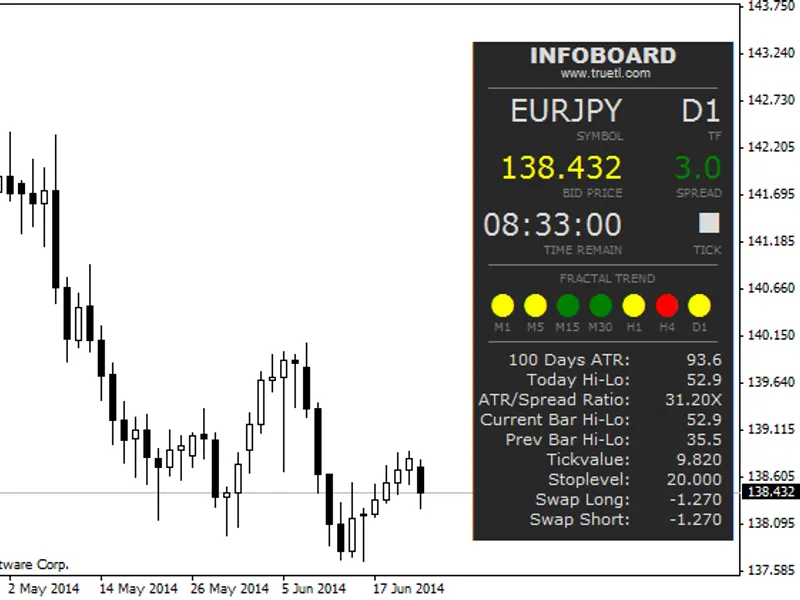
Displays essential trading information including spread, ATR, swap, and more.
The Fractal Trend feature indicates the current price's position relative to the last high and low fra...
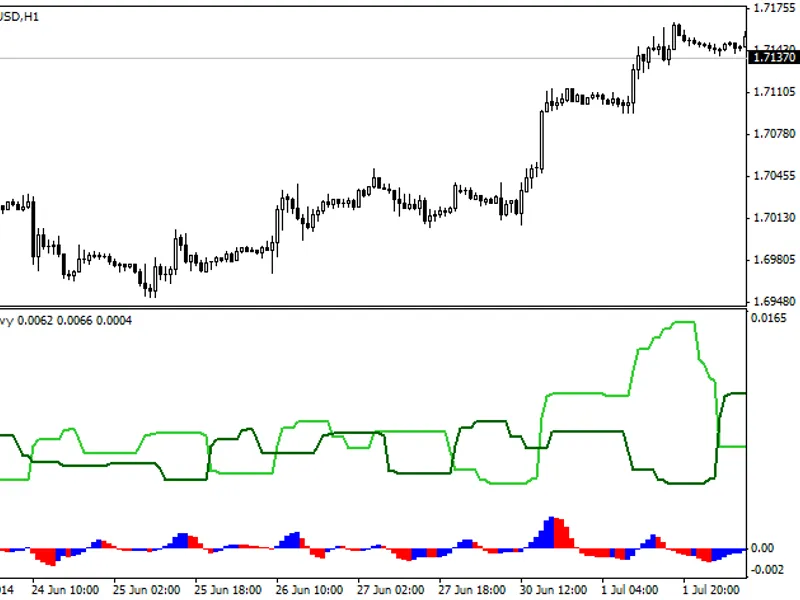
The Heavy indicator assists in identifying the correct trend before entering the market.Open trades when the lime line is greater than the green line and exit trades when the lime ...
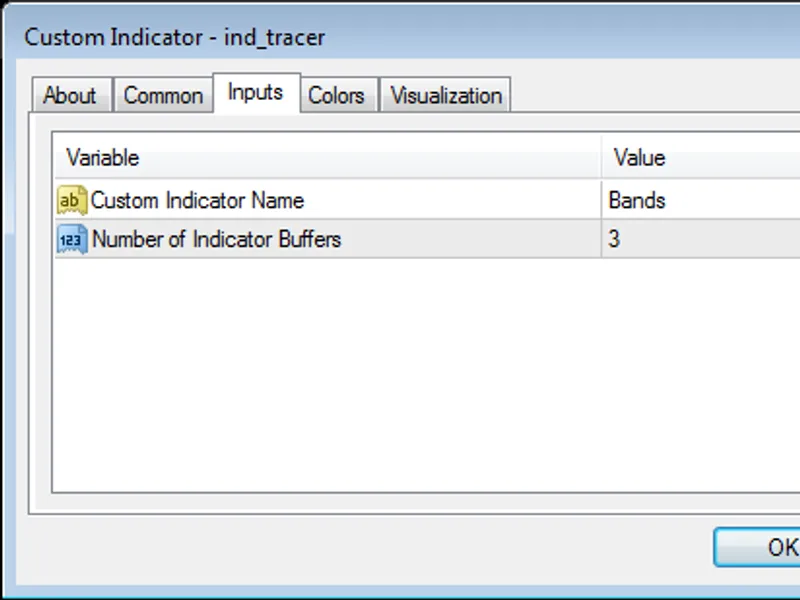
Indicator Tracer
Traces the output of indicators by buffer. The output can be adjusted on the chart by moving the vertical line left or right.This utility is particularly useful fo...
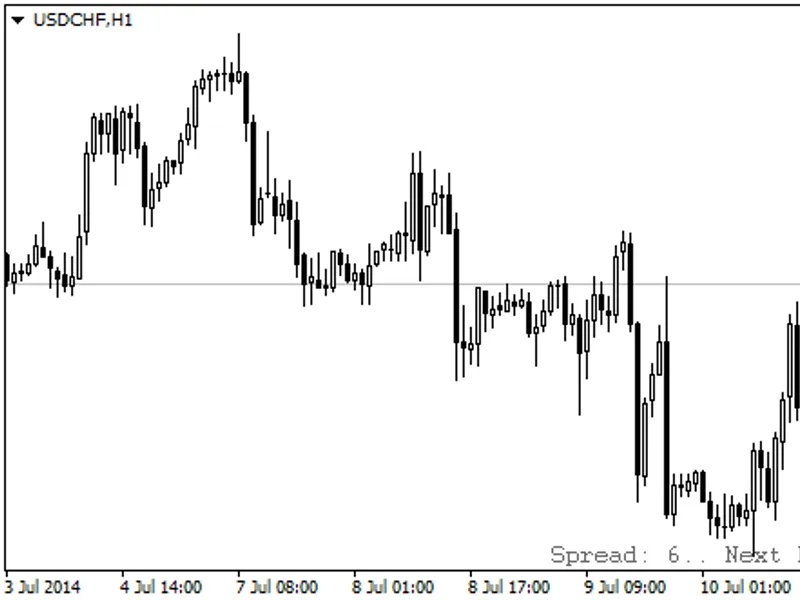
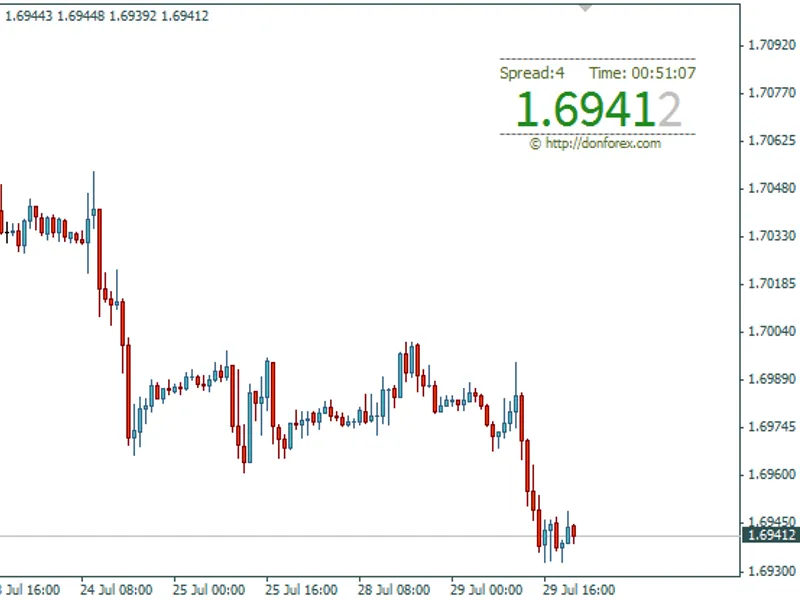
This indicator displays the closing time of the current candle and the current spread.This indicator was obtained from publicly available sources and is shared for informational pu...
This library provides a function to filter trading positions based on a specified time range.If the current time falls within the set interval, the function returns true, allowing ...
Close@Profit Expert Advisor
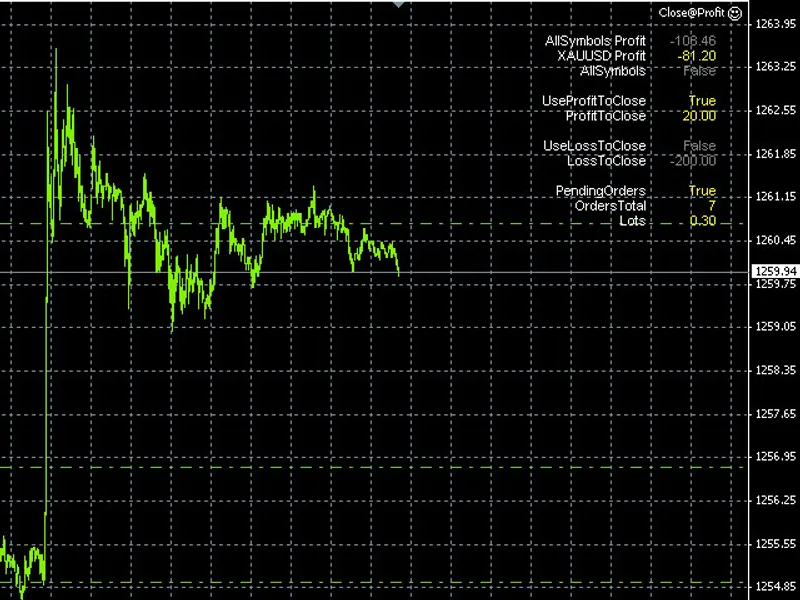
Close@Profit is an Expert Advisor that closes orders based on a defined profit or loss target.You can configure the EA to close trades only on the curre...
The BBWin indicator displays Bollinger Bands® in a separate window and includes trend lines.
This indicator is designed to provide a clear visual representation of market volatili...
A trading signal is generated when the price closes above or below both the 60-period and 100-period moving averages.This signal is valid only when the price confirms a close outsi...
RSI, CCI, and PercentRange indicators displayed directly within the chart window.These are popular momentum oscillators that provide valuable insights into market conditions.RSI (R...
This indicator identifies potential support and resistance levels following the development of a trend. Typically, the first pullback concludes around the EMA region.It displays th...
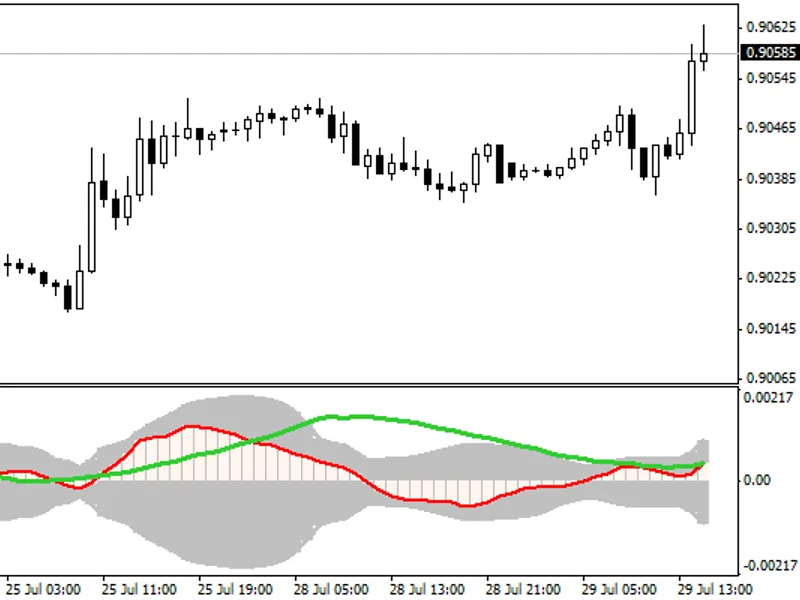
The MACD Momentum indicator is a technical tool that combines the MACD histogram with a momentum line.
The momentum line is calculated as the 10-day momentum of the MACD histogram,...
A comprehensive suite of scripts designed to efficiently close various types of orders in MetaTrader 4 and MetaTrader 5 platforms.The collection includes the following scripts:- cl...
Essential information for every trader.This indicator is tick and timer-based, eliminating the need to wait for new ticks to update time values. It is highly useful for displaying ...