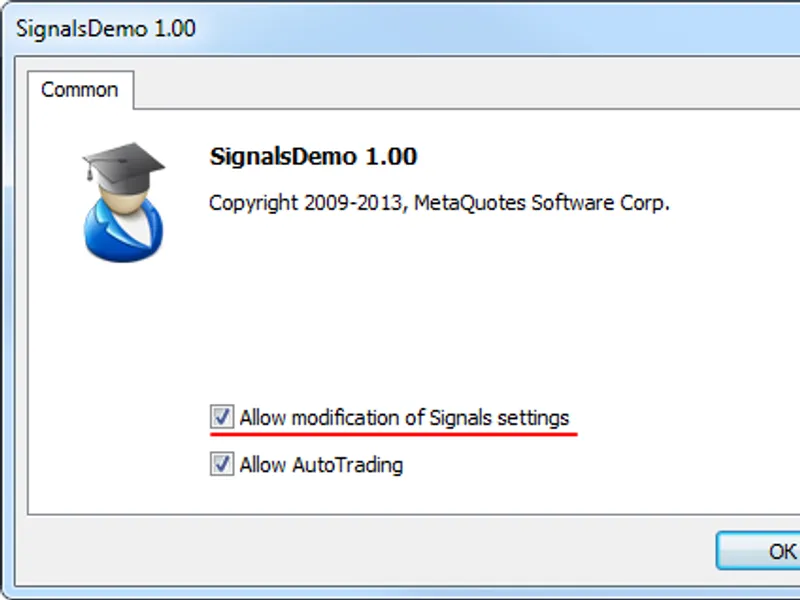
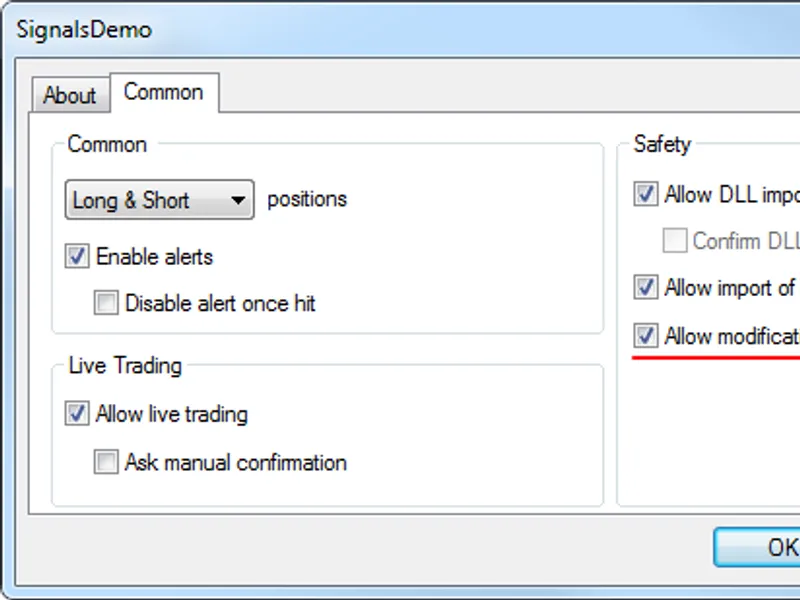
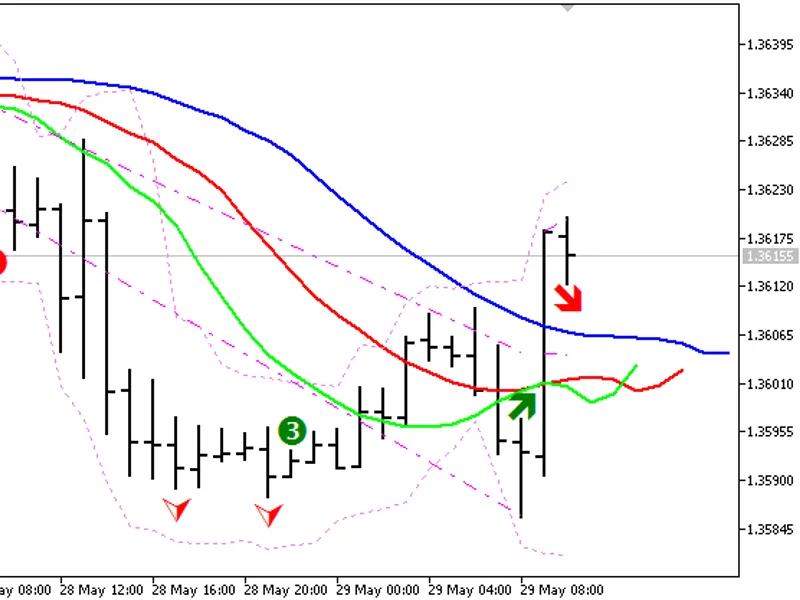
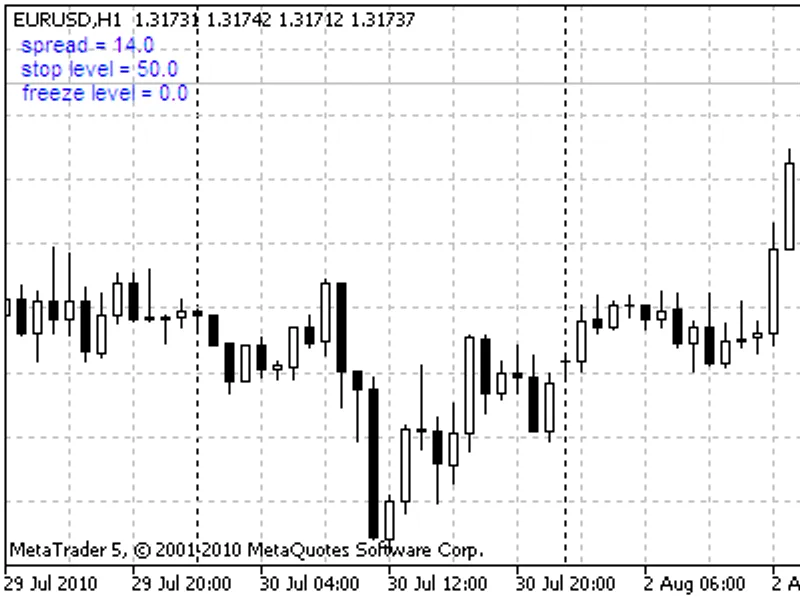
The Signal Demo Expert Advisor demonstrates the functionalities of trading signal management.The EA provides information on the features of available trading signals, allows users ...
The SignalsDemo Expert Advisor utilizes the trade signals functions. It displays signal properties available in the client terminal, enables modification of signal copy settings, a...
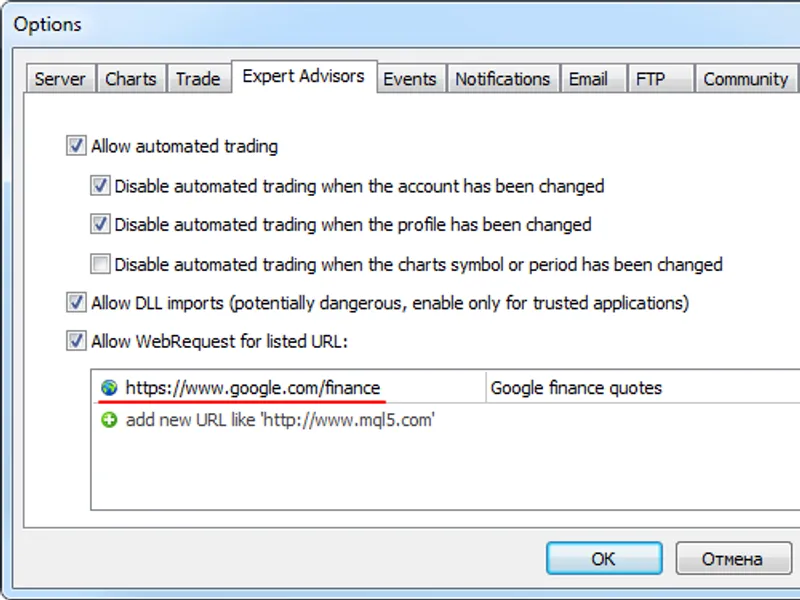
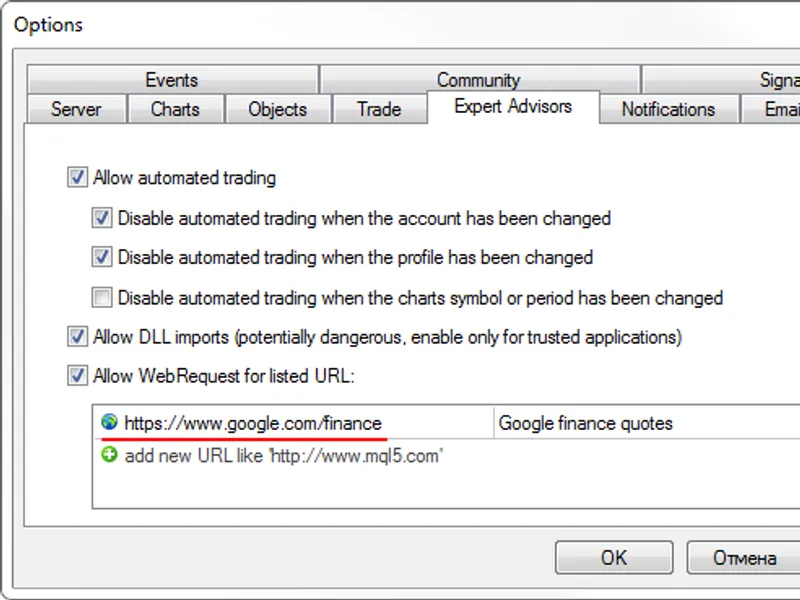
Example of retrieving world index quotes from Google Finance using the WebRequest function.Data is updated every 10 seconds.Add the URL to your trusted URL list. Navigate to Main M...
This Expert Advisor demonstrates retrieving real-time world stock index values from Google Finance using the WebRequest function.The quotes are updated automatically every 10 secon...
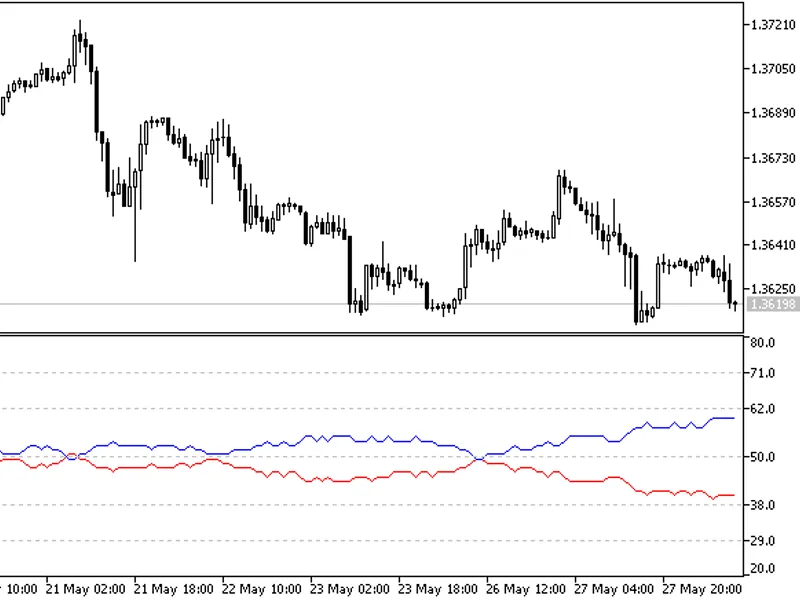
This indicator counts bullish and bearish candles within a specified bar period and calculates their respective percentages.It provides insights into trend completion and initiatio...
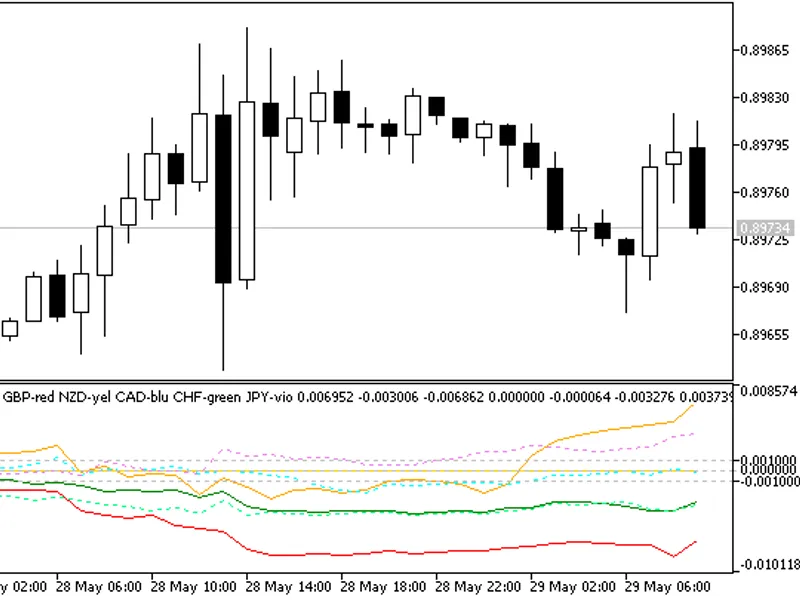
This indicator displays the movement of seven major currencies against the US dollar.All currencies are normalized to a starting point in time 'p'. An exponentially weighted moving...
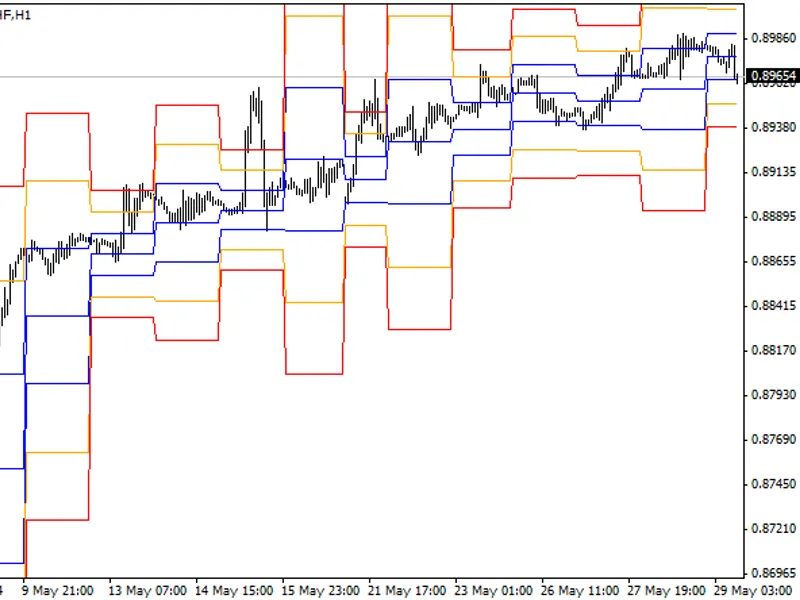
This indicator plots Stopd price levels based on a user-specified timeframe (D - Daily, W - Weekly, M - Monthly, Q - Quarterly, Y - Yearly).Additional parameters allow for customiz...
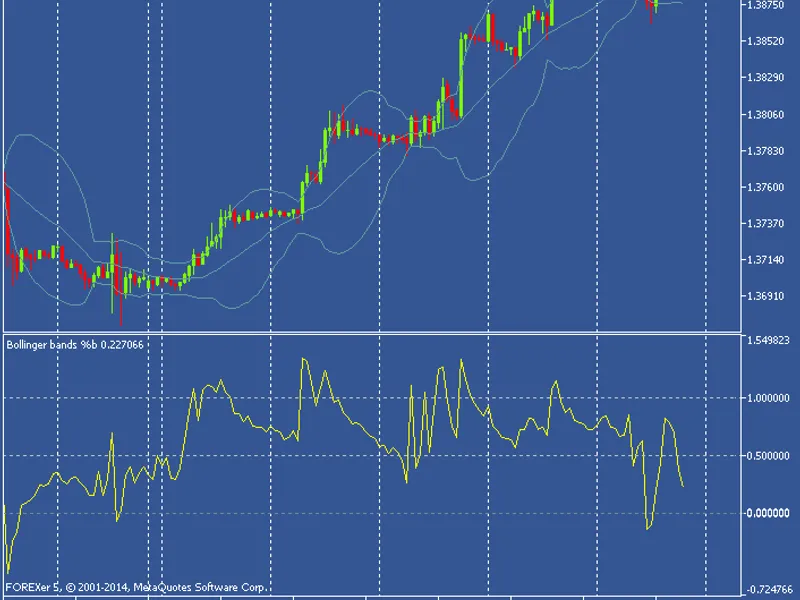
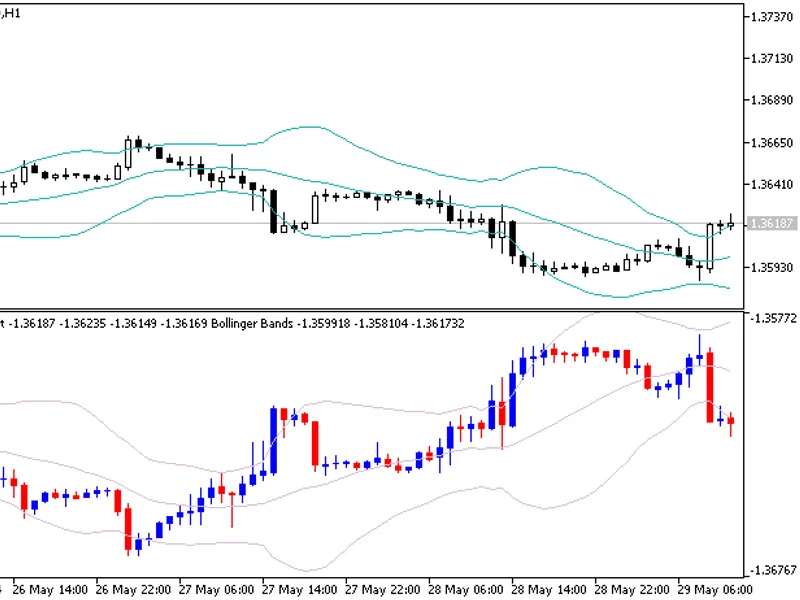
Bollinger Bands %b Indicator for MetaTrader 5.This indicator analyzes the relationship between price and the upper and lower Bollinger Bands.There are six primary relationships obs...
This indicator provides an inverted view of the chart to assist traders in identifying optimal short entry points.Usage:1. Drag and drop the InvertedChart indicator onto your desir...
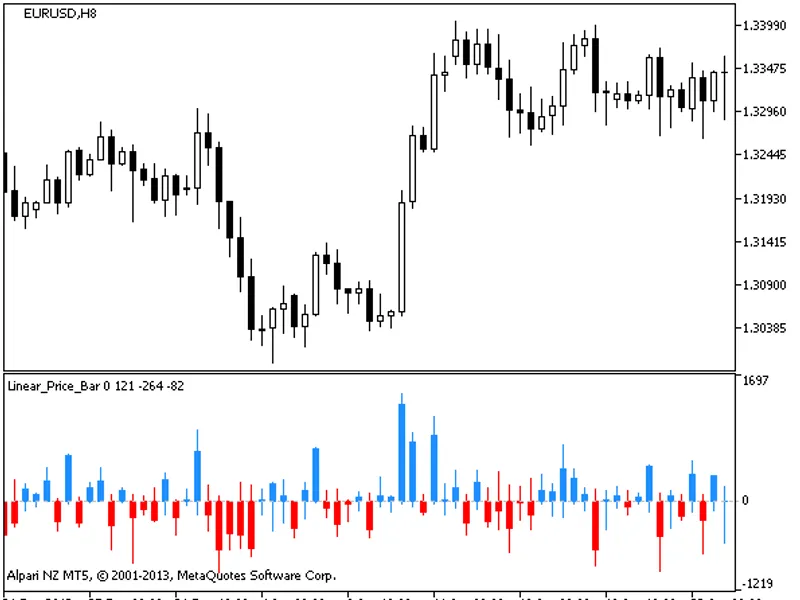
A candlestick chart where all open prices are shifted to zero.This indicator was first implemented in MQL4 and published on MQL4.com on 13.09.2007.Figure 1. The linear_price_bar in...
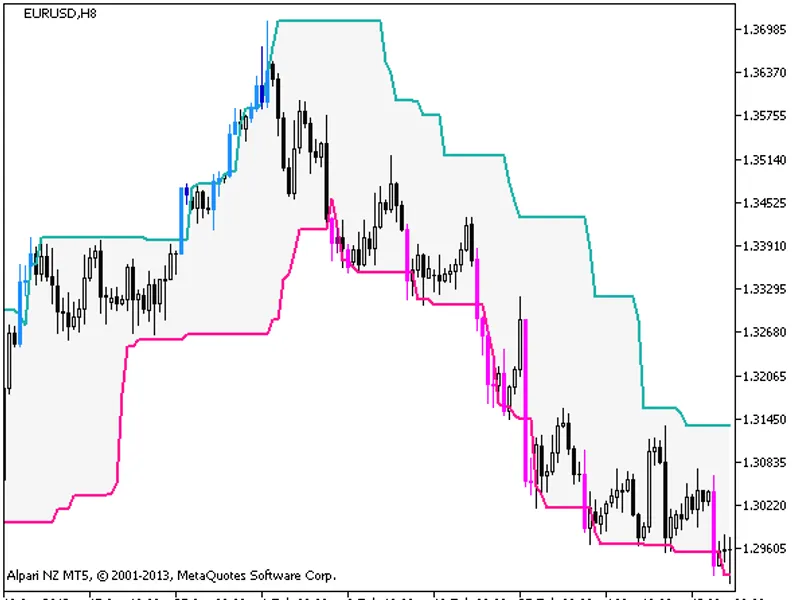
The indicator implements a system using a channel drawn on extrema for a specified period.When the price exits the gray channel, the candlestick color changes to indicate the trend...
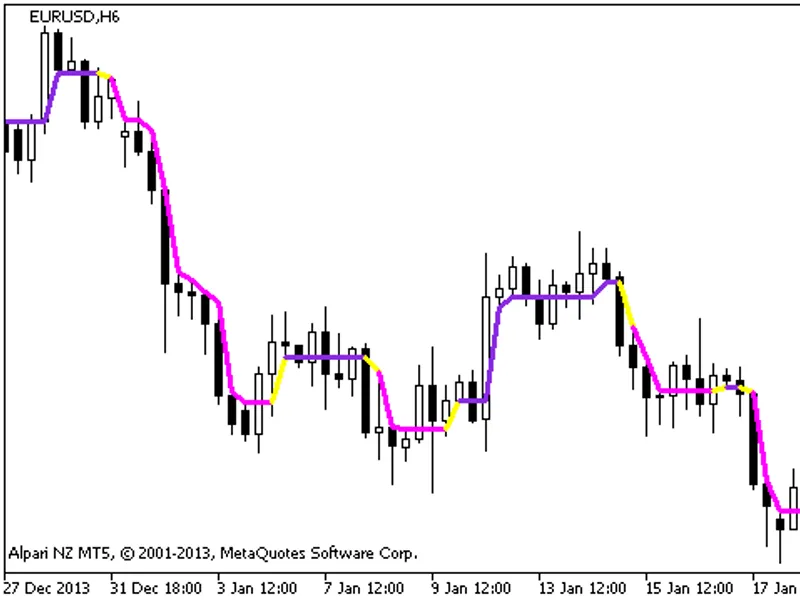
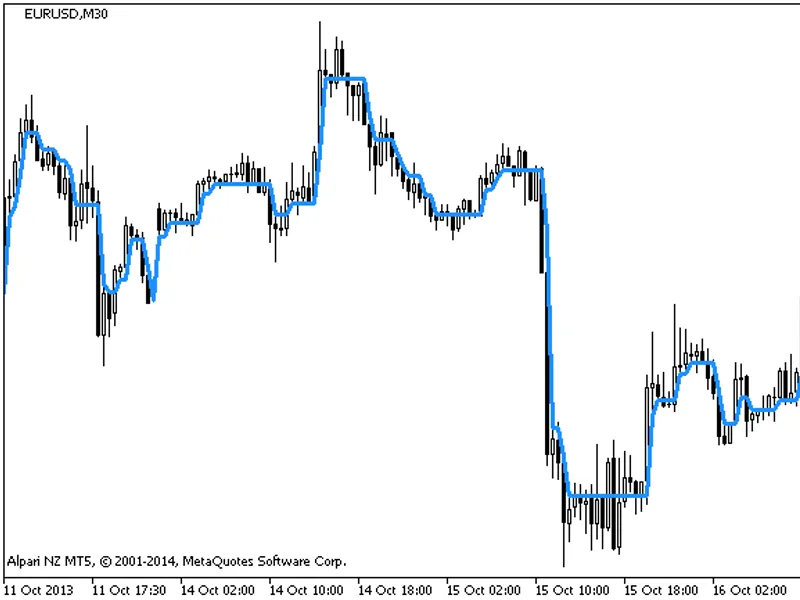
A trend indicator that does not use averaging.The line changes to yellow when the trend shifts.The indicator colors the line purple for an uptrend and pink for a downtrend.This ind...
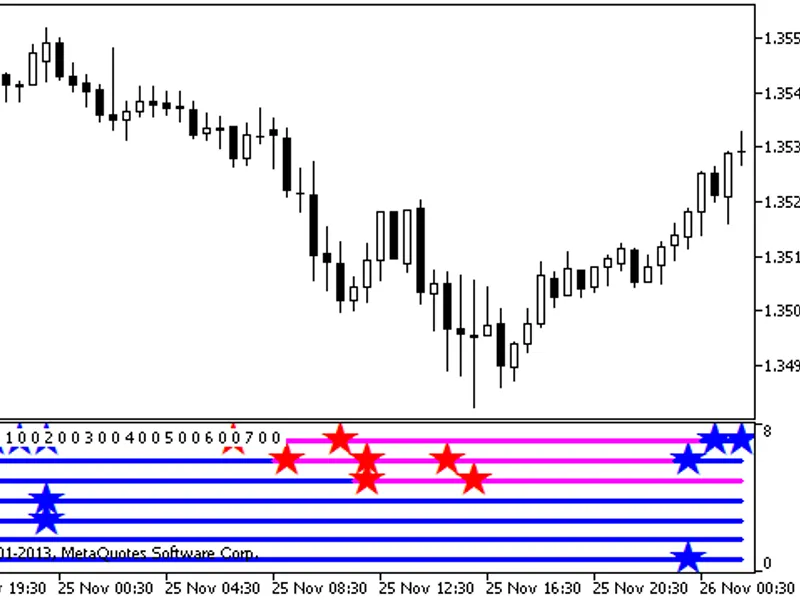
The Multi Highs Lows Signal indicator displays active trend information by synthesizing data from seven indicators across various timeframes.Each line within the indicator correspo...
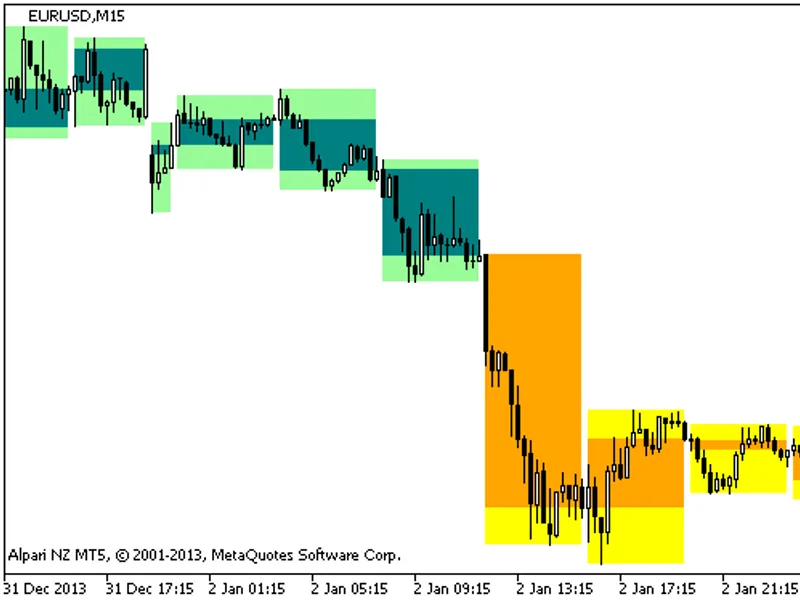
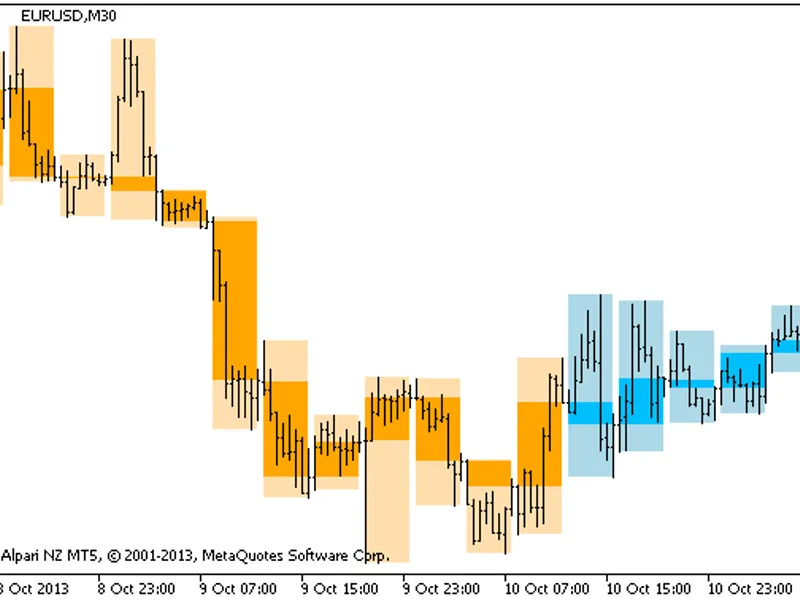
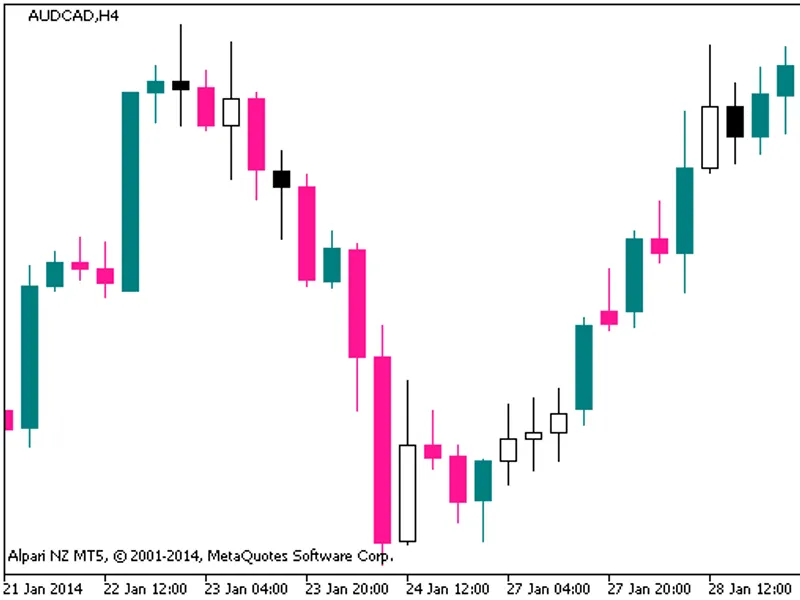
This indicator visualizes larger timeframe candlesticks as colored, filled rectangles using buffers. The rectangles are colored based on indicator values. The candlestick body is p...
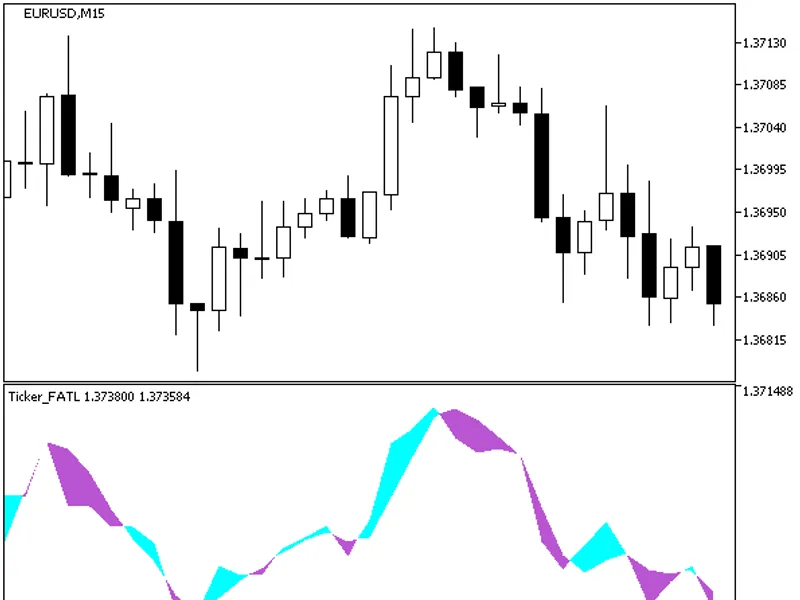
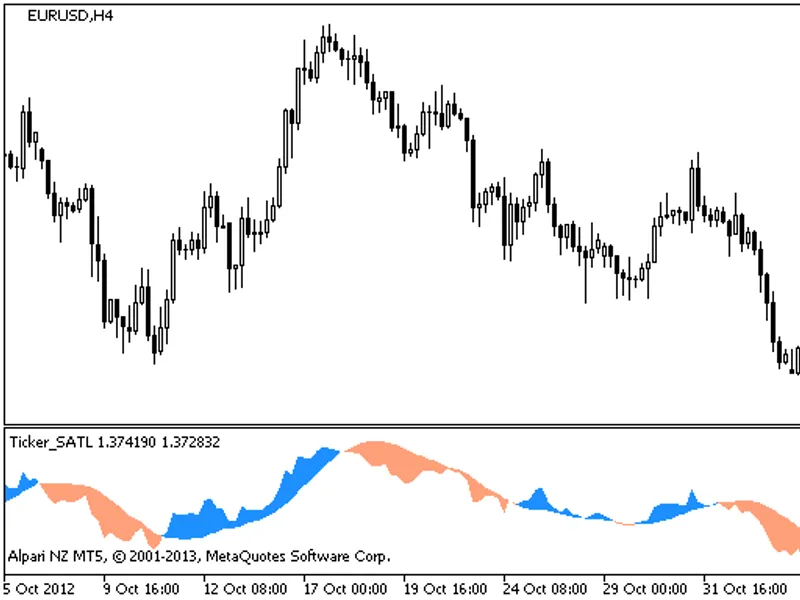
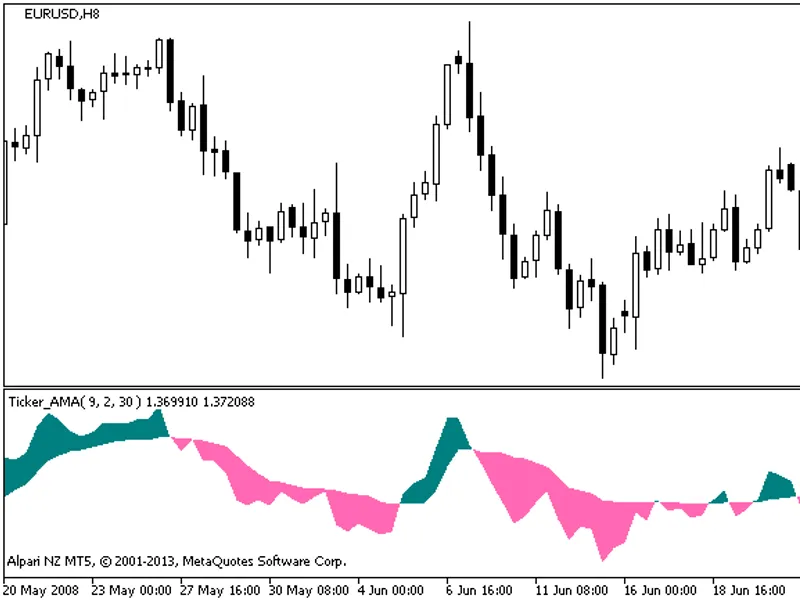
The Ticker FATL indicator is displayed as a colored cloud positioned between the lines of a fast digital filter and the price.This indicator was initially developed for MQL4 and wa...
Exp Dynamic RS C is a trading system that utilizes a specific indicator for trade decisions.A trade signal is generated when the direction of the indicator's movement changes.For t...
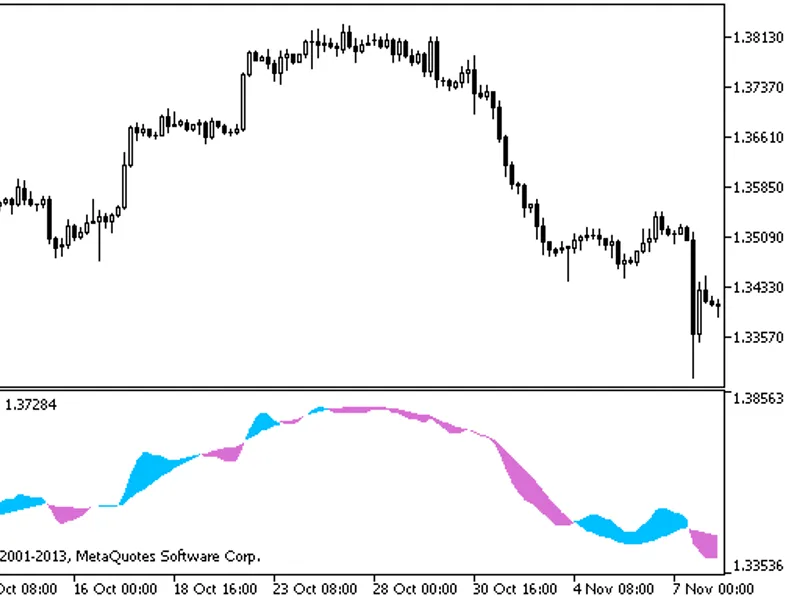
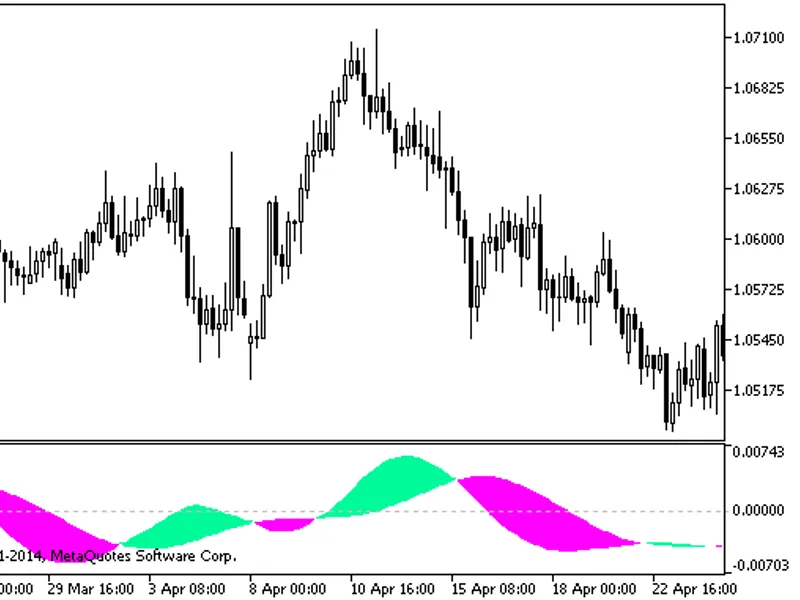
A colored cloud indicator generated by the lines of digital filters. The indicator utilizes smoothing algorithms from the smoothalgorithms.mqh library classes. These classes must b...
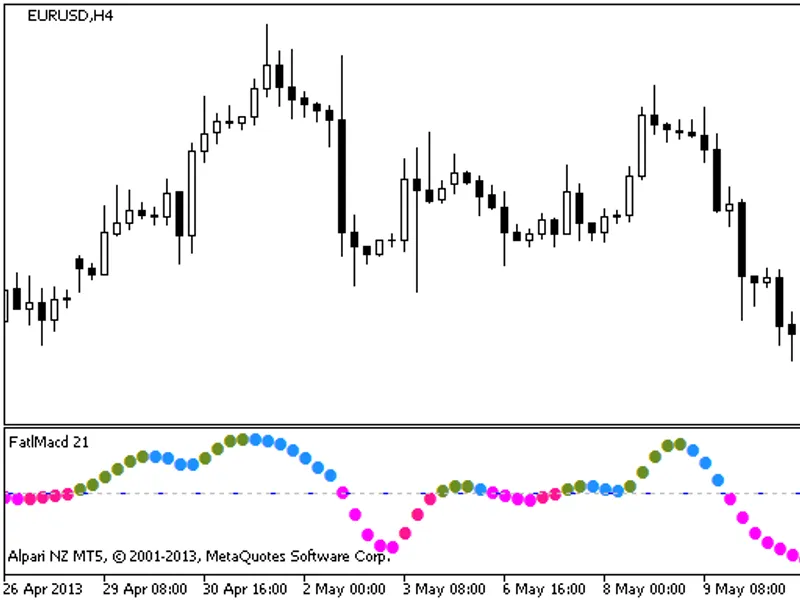
This is an oscillator based on the averaged difference between a digital filter and the close price.The indicator utilizes smoothing algorithms from the smoothalgorithms.mqh librar...
The indicator is visualized as a colored cloud situated between the lines of a slow digital filter and the price.This indicator was initially developed for MQL4 and was first publi...
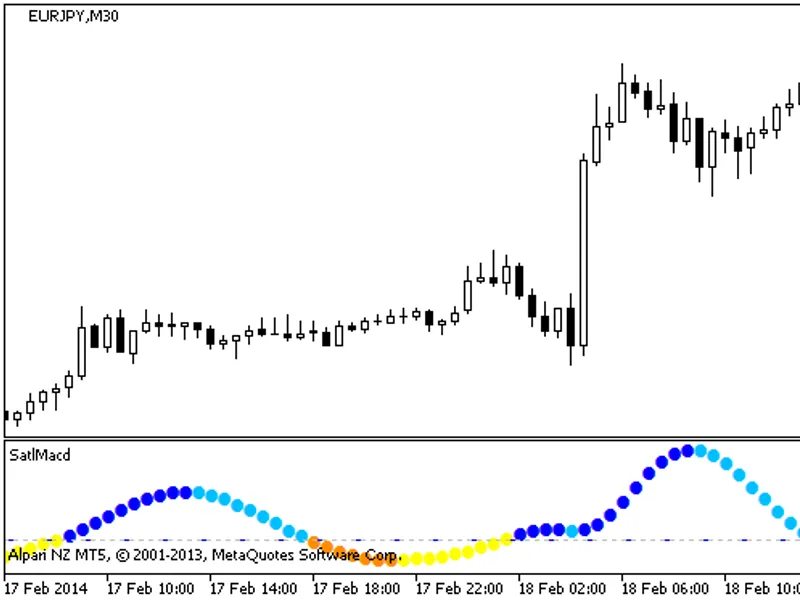
SATL MACD IndicatorThis indicator is an oscillator based on the averaged difference between a digital filter and the close price.The indicator uses SmoothAlgorithms.mqh library cla...
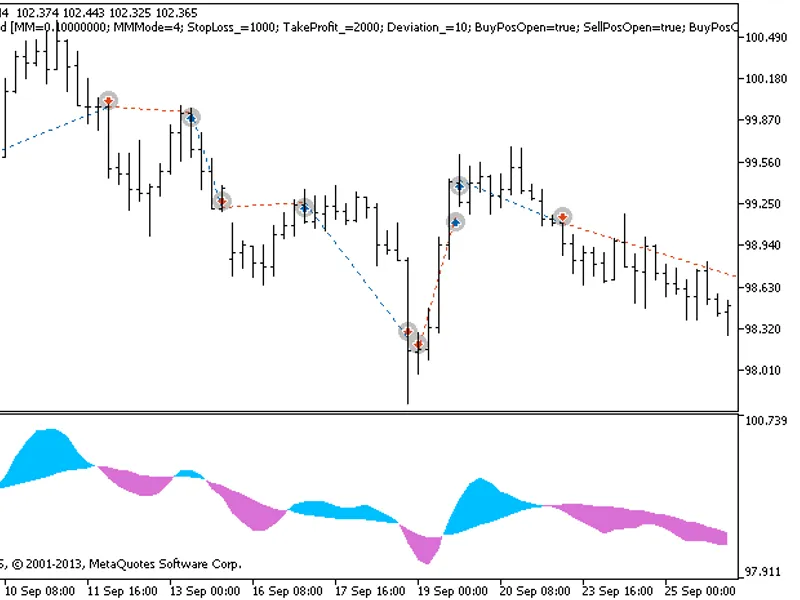
The Exponential Digit MACD Expert Advisor (EA) utilizes signals from the Digit MACD indicator.A signal is generated when the indicator's cloud color changes at the close of a bar.T...
This indicator displays larger timeframe candlesticks as colored, filled rectangles using indicator buffers. The rectangle colors correspond to the colors of the indicator cloud.Th...
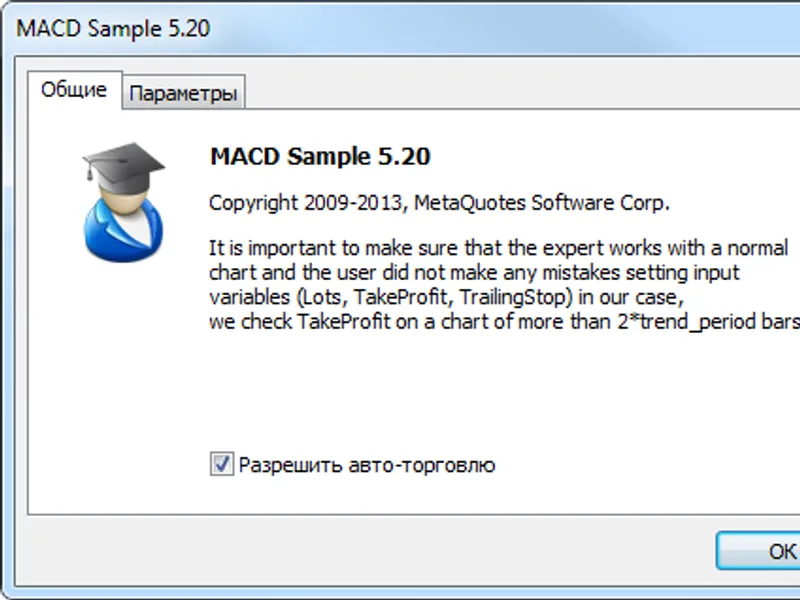
The MACD Sample EA is included in the standard pack of the client terminal and is an example of an EA that trades using the MACD indicator.The file of the MACD Sample.mq5 expert ad...
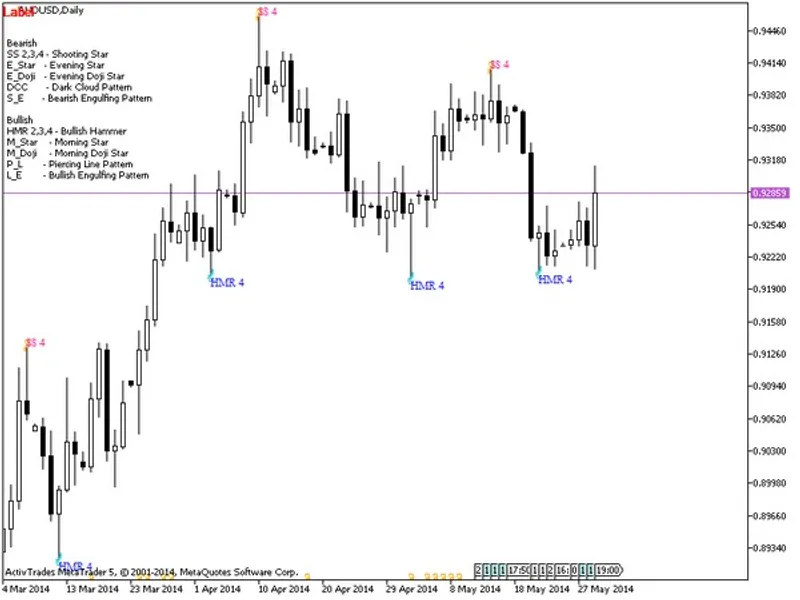
Japanese Candlestick Patterns IndicatorThis indicator displays Japanese candlestick patterns directly on your charts.The indicator was sourced and adapted from earnforex.com, origi...
The indicator displays entry points.The system is described in the accompanying documentation.This is a tool for traders to identify potential trading opportunities based on specif...
This library allows for sending text messages with necessary information via Skype in automatic trading. It works with Skype through the skype4com library, an ActiveX component tha...
This oscillator was rewritten from Amibroker formula language (AFL) to MQL4.
It serves for definition of a trend by formed characteristic reversed parts of the indicator in the int...
Introduction
Since 2026, most dealing centers have begun working with floating spreads. During the night, the spreads are often wider, and wide spreads appear during news events.
...
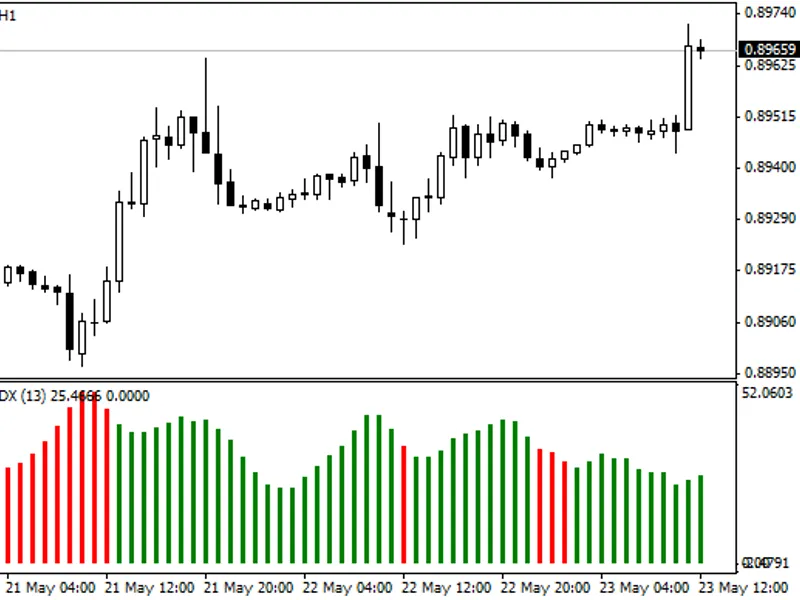
An advanced implementation of the Average Directional Index (ADX) indicator.This indicator is designed to measure trend strength and direction.It utilizes a modified calculation to...
This Expert Advisor (EA) is developed in the MQL4 language.It utilizes the following indicators for trading decisions:- Simple Moving Average (SMA) with a period of 100 bars.- Aver...
This tool provides scripts to quickly navigate through charts and change timeframes across all open charts using hotkeys. The inspiration for this tool comes from the chartnext scr...
This is a template designed for expert advisor coders to significantly reduce their development time.Key features include:- Trailing Stop functionality- Autolot calculation (config...
Dynamic RS Channel Indicator
This is an indicator that functions as a channel with a fixed width, designed without using averaging. Its core logic is clearly defined within its im...
An indicator belonging to the series of simple indicators that do not use averaging.Dynamic RSI IndicatorThis indicator is part of a collection of simple indicators designed to avo...
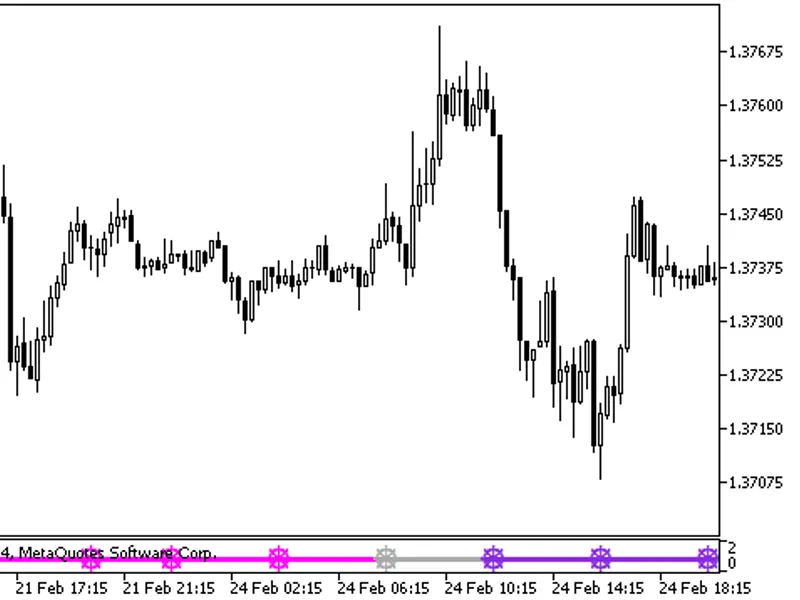
The Dynamic RSI C Signal indicator displays current trend information using values from a fixed timeframe indicator.The signal is derived from the color of the histogram bars of th...
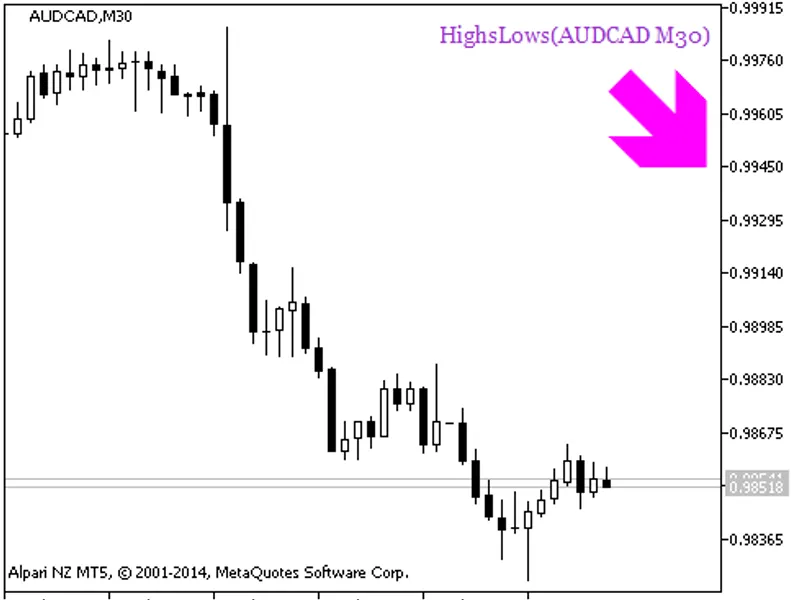
This indicator, Highs Lows HTF Signal, displays trend direction or trading signals on a chosen bar. It uses colored graphic objects to indicate the trend or trade direction and pro...
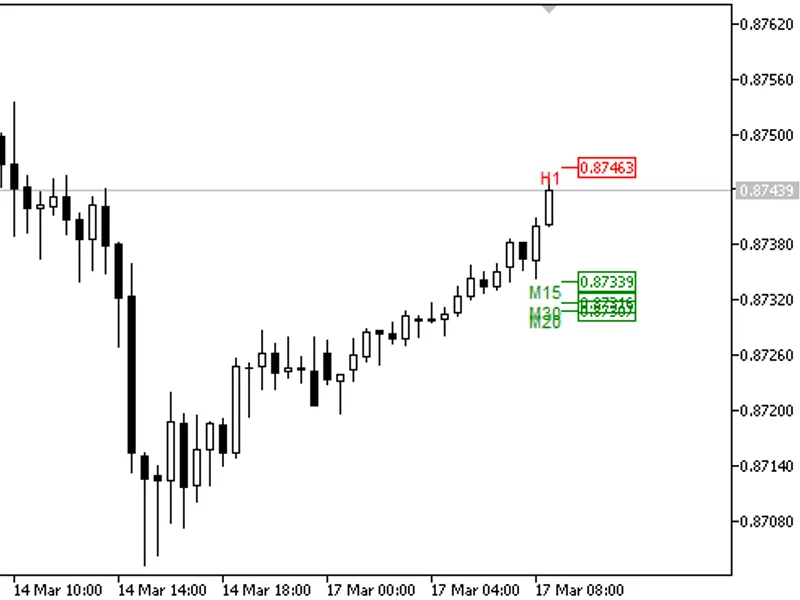
This indicator displays SuperTrend pivot levels based on its direction and current value across multiple timeframes.It is useful for visualizing higher timeframe pivot levels.Prere...
The i-OneThird indicator displays candlesticks that represent bullish and bearish patterns in a style similar to Heiken Ashi.The indicator divides the difference between the high a...
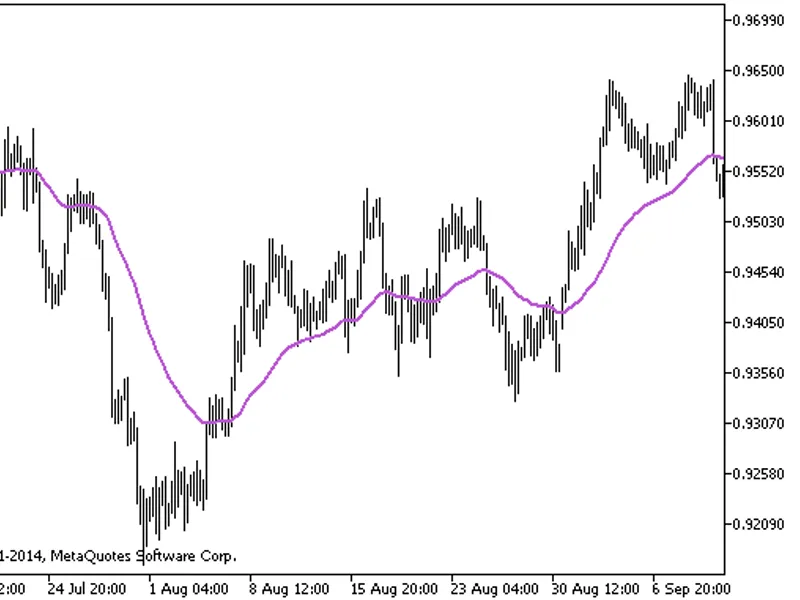
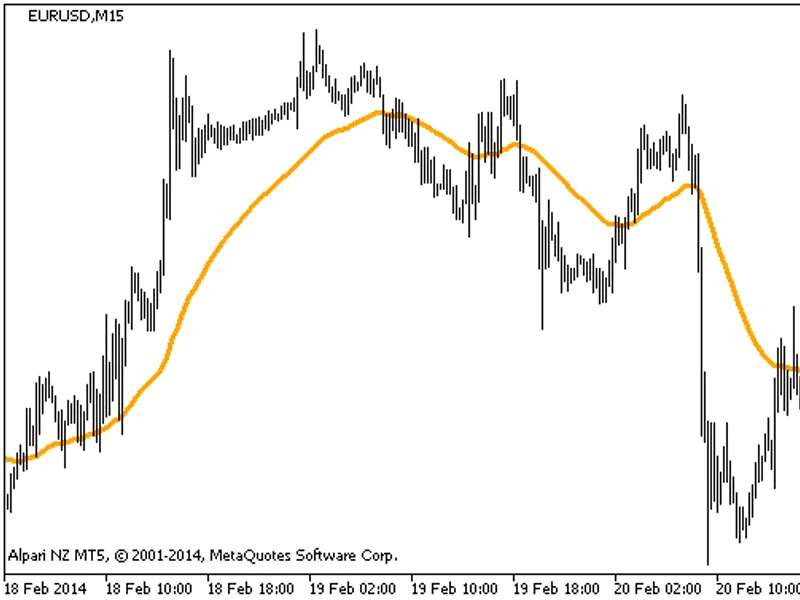
The i-AMA Optimum indicator is based on the Adaptive Moving Average developed by Perry Kaufman.This indicator was first implemented in MQL4 and published in 2026.Indicator i-AMA Op...
AMMA IndicatorThe AMMA indicator is a modified moving average that functions as a filter.Calculation:The indicator is calculated using a 25-day modified moving average.Usage:It is ...
Cronex AO
This indicator replaces the price series with a series of technical indicator values, visualized as a colored cloud. The indicator utilizes smoothing algorithms from the...
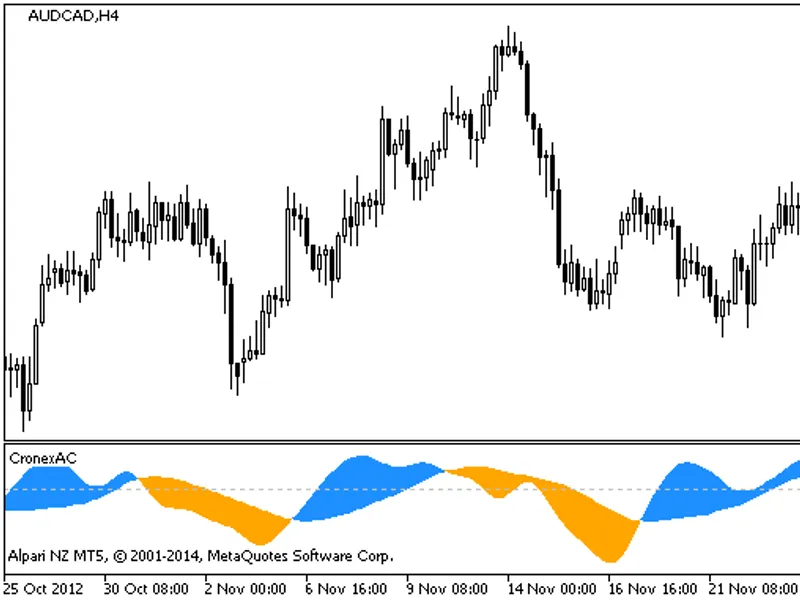
Cronex ACThis indicator replaces the price series with the values of a technical indicator, displayed as a colored cloud.The indicator utilizes the algorithms from the smoothalgori...
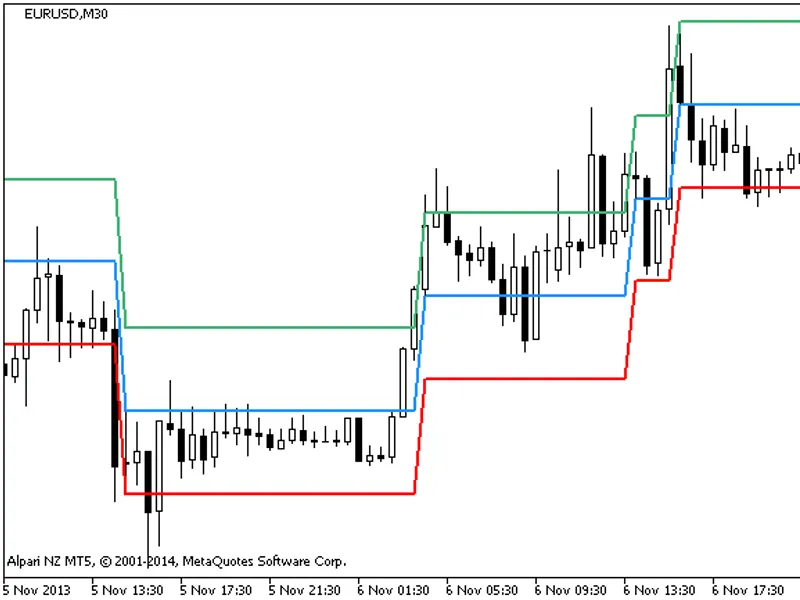
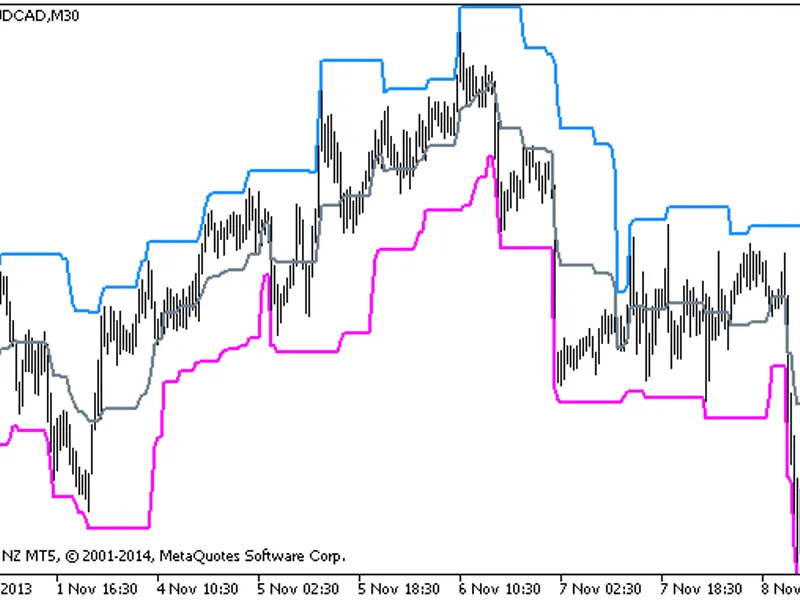
The i-HighLow indicator draws a channel. The channel borders correspond to the highest and lowest values of candlestick shadows for a specified number of bars. A vertical shift is ...
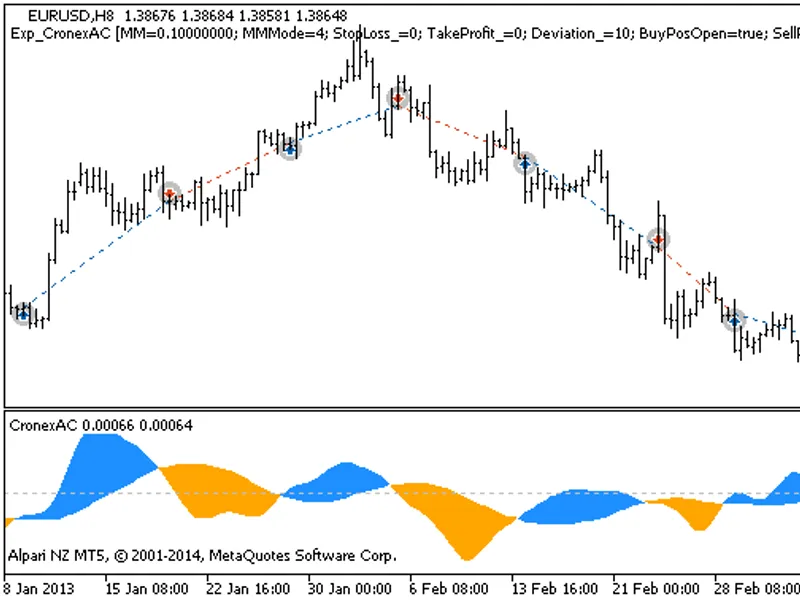
The EXP CronexAC EA is based on signals generated by an oscillator. A signal is formed when a bar is closing, and there is a change in the indicator's cloud color. For correct oper...