Williams'Accumulation/Distribution (W A/D)
Info
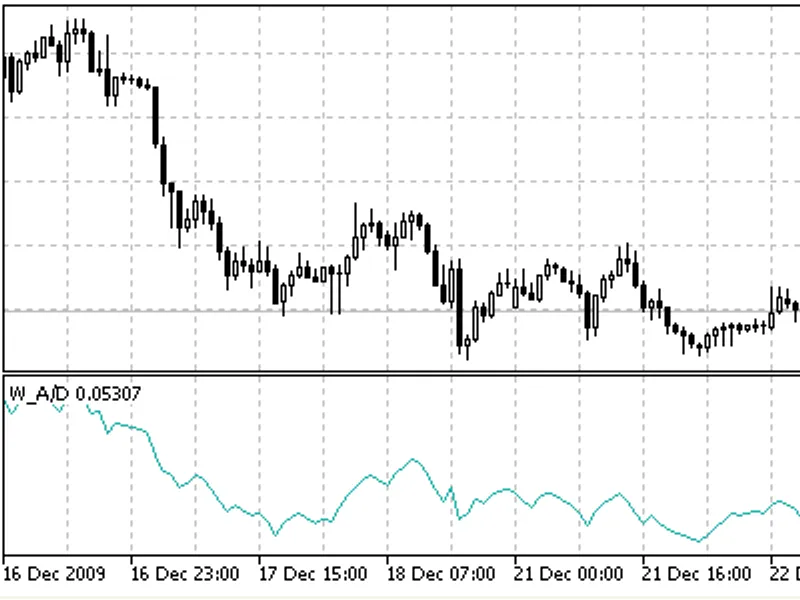
The Williams'Accumulation/Distribution (W A/D) is a Indicator for MetaTrader 5 that williams' a/d is the accumulated sum of positive "accumulational" and negative "distributional" price movements. For example, if the current closing price is higher than the previous one, W/AD increases by the difference between the current closing price and the true minimum.
Usage
This tool is typically used for enhancing chart analysis and decision making.
Platform
This Indicator works exclusively on MetaTrader 5 (both build 600+ and newer versions).
Setup
Place the downloaded file in MQL5/Indicators folder via File ? Open Data Folder in MetaTrader 5.
How to Install and Use Williams'Accumulation/Distribution (W A/D)
1. Installation: Place your file in the MQL/Indicators folder via "Open Data Folder" and restart your terminal.
2. Loading: Find the indicator in the Navigator, drag it onto your chart, and configure the input parameters in the popup window.
3. Customization: Press Ctrl+I to open the indicator list, select your tool, and click "Properties" to change colors, levels, or visual styles.
4. Updating: Replace the old file in the Indicators folder with the new version and restart the platform to apply changes.
Frequently Asked Questions
Q: Why is my indicator not showing? A: Verify the file is in the MQL/Indicators folder, or try right-clicking the "Indicators" tree in the Navigator and clicking "Refresh."
Q: Do custom indicators slow down the platform? A: Too many complex indicators can impact performance; remove unused ones via the "Indicator List" (Ctrl+I).
Q: Can I use MT4 indicators on MT5? A: No, MQL4 and MQL5 are distinct languages; ensure the indicator is compiled specifically for your platform version.
What this tool does
Williams' A/D is the accumulated sum of positive "accumulational" and negative "distributional" price movements.
Typical Use Case
This Indicator excels in automated trading and technical analysis on MetaTrader 5.
Compatible Platform & Setup
This Indicator works on MetaTrader 5. Place the file in the MQL5/Indicators folder and restart the terminal.
Description & Settings
Related: Differential Average By Sultonov HT F - another powerful indicator for MetaTrader 5 traders.
Williams' A/D is the accumulated sum of positive "accumulational" and negative "distributional" price movements.
Also recommended: Background Candle Cronex AC HT F - similar indicator with strong performance on MetaTrader 5.
For example, if the current closing price is higher than the previous one, W/AD increases by the difference between the current closing price and the true minimum. If the current closing price is lower than the previous one, W/AD decreases by the difference between the current closing price and the true maximum.The term "accumulation" denotes a market controlled by purchasers and the term "distribution" means that sellers control the market.Divergences between the indicator and the price are a signals. Like most indicators, W/AD leads the tool price. In other words, when a divergence appears, the price changes its direction according to the indicator.
If the price reaches a new maximum, but the accumulation/distribution indicator cannot reach a new maximum, it means that the security is distributing itself. It is a signal for sell.
If the price reaches a new minimum, but the accumulation/distribution indicator cannot reach a new minimum, it means that the security is accumulating. It is a signal for buy.
Williams'Accumulation/Distribution indicator
Calculation:
To calculate the accumulation/distribution indicator, first you have to find a "True Range High" (TRH) and "True Range Low" (TRL):
TRH (i) = MAX (HIGH (i) || CLOSE (i - 1))TRL (i) = MIN (LOW (i) || CLOSE (i - 1))
Then you must find the current value of accumulation/distribution (CurA/D) by comparing today and yesterday's closing prices.
If the current closing price is higher than the previous one, then:
CurА/D = CLOSE (i) - ТRL (i)
If the current closing price is lower than the previous one, then:
CurА/D = CLOSE (i) - ТRH (i)
If current and previous closing prices coincide then:
CurА/D = 0
Williams' accumulation/distribution indicator is a growing sum of these values for each day:
WА/D (i) = CurА/D + WА/D (i - 1)
where:
TRH (i) - the True Range High;
TRL (i) - the True Range Low;
MIN - the minimum value;
MAX - the maximum value;
|| - the logical OR;
LOW (i) - the minimum price of the current bar;
HIGH (i) - the maximum price of the current bar;
CLOSE (i) - the closing price of the current bar;
CLOSE (i - 1) - the closing price of the previous bar;
CurА/D - means current value of accumulation/distribution;
WА/D (i) - the current value of William's Accumulation/Distribution indicator;
WА/D (i - 1) - the value of William's Accumulation/Distribution indicator on the previous bar.
You may also like: Stochastic experiment - excellent alternative for indicator users on MetaTrader 5.
⚠ Limitations & Risk Warning
- This tool is provided for educational and testing purposes only.
- Past performance does not guarantee future results.
- Trading involves substantial risk of loss. Use on a demo account first.
- Results may vary depending on market conditions, broker, and settings.
- We recommend thorough backtesting and forward testing before using with real funds.