Volume Profile + Range
This is a powerful addition to your MetaTrader 5 toolkit designed to optimize market analysis and performance. This technical indicator acts as a specialized analysis tool designed to visualize market data. It helps traders identify emerging trends, momentum shifts, and key support or resistance levels by plotting statistical calculations directly onto price charts.
How to Setup and Use Volume Profile + Range
1. Installation: Place your file in the MQL/Indicators folder via "Open Data Folder" and restart your terminal.
2. Loading: Find the indicator in the Navigator, drag it onto your chart, and configure the input parameters in the popup window.
3. Customization: Press Ctrl+I to open the indicator list, select your tool, and click "Properties" to change colors, levels, or visual styles.
4. Updating: Replace the old file in the Indicators folder with the new version and restart the platform to apply changes.
Frequently Asked Questions
Q: Why is my indicator not showing? A: Verify the file is in the MQL/Indicators folder, or try right-clicking the "Indicators" tree in the Navigator and clicking "Refresh."
Q: Do custom indicators slow down the platform? A: Too many complex indicators can impact performance; remove unused ones via the "Indicator List" (Ctrl+I).
Q: Can I use MT4 indicators on MT5? A: No, MQL4 and MQL5 are distinct languages; ensure the indicator is compiled specifically for your platform version.
Description & Settings
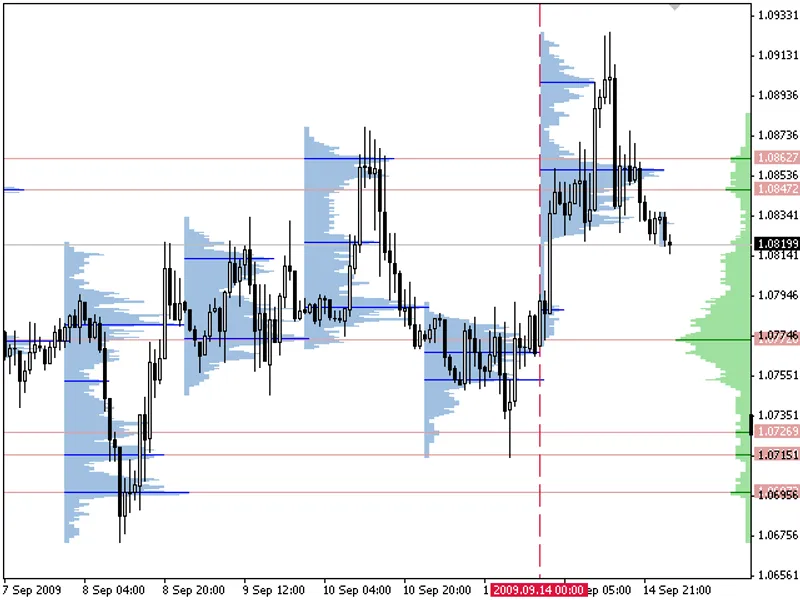
Volume Profile + Range v6.0 (former TPO). Distribution of deals by price levels at a given time interval. Displayed as a histogram. The width of the histogram at the level means the number of transactions carried out on it.
If a broker provides data on a real volume, the indicator is able to display distribution on it as well.
Key features:
VP: display distributions with a step equal to standard periods
VP-Range: display distributions for any selected period using various methods of setting the calculation boundaries
configuring displayed data (histogram, modes, maximum)
ability to launch several indicators on a single chart
VP divides the chart into intervals (equal by time) displaying distribution for each of them. The ranges can be equal only to standard timeframe values not lower than the current one. For example, for H1, the range can be specified as H1, H4, D1, W1, MN1. MT5 features intermediate timeframes.
VP-Range works only by a single range. The boundaries can be specified by one of the following ways:
arbitrarily by vertical lines
using the number of the last chart minutes
setting the right border and number of minutes to it
When specifying the borders by lines, the bar of the right border is not considered in the calculations. This is done in order to prevent source data and distribution type from changing when switching timeframes.
Bars from higher timeframes may contain less bars from lower ones compared to our expectations. This occurs due to natural gaps in quote history caused by low liquidity and operation interruptions. Therefore, if we make the indicator show a week before a bar, the time of the left boundary may not coincide with the time of the right one. In different dealing centers, the data may be different but the result turns out to be similar due to a large amount of applied data.
Calculation method
The calculation method is summing the number of deals performed at a certain price. Alternatively, the volumes at a certain price can be summed if the real volume type is set in the parameters.
The trade data is interpolated based on the most accurate terminal data available (М1 timeframe data). Each bar is divided into several trades based on the estimated price movement inside the bar. This is a distinguishing feature of the product setting it apart from other ones that have no interpolation and use the timeframe the indicator is launched at.
A further accuracy improvement without the use of additional sources could have been reached due to more reliable interpolation of M1 data to ticks. But almost every broker using MetaTrader 4 has its own quote flow making such improvements practically useless. Tests show that distributions look almost similar at all brokers. Used methods provide results comparable to distributions received using the most accurate data.
Distributions maximums (modes) are usually used as support/resistance levels. There is no point in searching for a maximum mode when determining a good level due to a "shading problem" - the next price cluster greatly affects the previous one sometimes hiding it completely, and vice versa. Study the chart carefully and specify the levels by constructing distributions on the most interesting segments with the help of VP-Range. Distributions at a bigger range may have greater weight.
Installation
Open the terminal settings (Tools\Options). Set the maximum number of bars depending on how you will use the indicator on the Charts tab. Each day is 1440 minutes (not more than 1440 minute bars). For example, if "Max bars in chart" is 250000, the indicator will be able to receive data for 250000/1440=173 working days in case M1 timeframe data is available for them. The value of 65000 provides data for 45 working days (two months and a couple of days).
Setting the number of bars
Restart the terminal after changing the parameters. In case a large value is specified for "Max bars in chart" parameter, the terminal may significantly slow down and require more memory even without the indicators. Please keep in mind that not all dealing centers provide deep chart history.
Installing the indicator:
close the terminal
download the archive with the indicators and unzip it
copy the indicator files (*.mq4 or *.mq5) to the indicator folder of your terminal. The working folder can be seen in the journal when launching the terminal
launch the terminal
VP and VP-Range general parameters
VP parameters
VP-Range parameters