Volume Average
This is a powerful addition to your MetaTrader 5 toolkit designed to optimize market analysis and performance. This technical indicator acts as a specialized analysis tool designed to visualize market data. It helps traders identify emerging trends, momentum shifts, and key support or resistance levels by plotting statistical calculations directly onto price charts.
How to Setup and Use Volume Average
1. Installation: Place your file in the MQL/Indicators folder via "Open Data Folder" and restart your terminal.
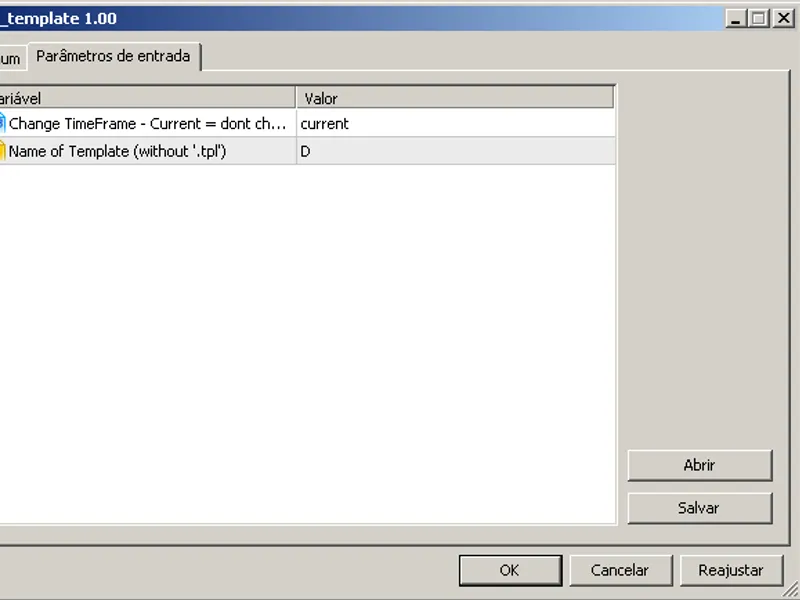
2. Loading: Find the indicator in the Navigator, drag it onto your chart, and configure the input parameters in the popup window.
3. Customization: Press Ctrl+I to open the indicator list, select your tool, and click "Properties" to change colors, levels, or visual styles.
4. Updating: Replace the old file in the Indicators folder with the new version and restart the platform to apply changes.
Frequently Asked Questions
Q: Why is my indicator not showing? A: Verify the file is in the MQL/Indicators folder, or try right-clicking the "Indicators" tree in the Navigator and clicking "Refresh."
Q: Do custom indicators slow down the platform? A: Too many complex indicators can impact performance; remove unused ones via the "Indicator List" (Ctrl+I).
Q: Can I use MT4 indicators on MT5? A: No, MQL4 and MQL5 are distinct languages; ensure the indicator is compiled specifically for your platform version.
Description & Settings
Long known volume analysis method.
In capital markets, volume, or trading volume, is the amount (total number) of a security (or a given set of securities, or an entire market) that was traded during a given period of time. In the context of a single stock trading on a stock exchange, the volume is commonly reported as the number of shares that changed hands during a given day. The transactions are measured on stocks, bonds, options contracts, futures contracts and commodities. The average volume of a security over a longer period of time is the total amount traded in that period, divided by the length of the period. Therefore, the unit of measurement for average volume is shares per unit of time, typically per trading day.
Trading volume is usually higher when the price of a security is changing. News about a company's financial status, products, or plans, whether positive or negative, will usually result in a temporary increase in the trade volume of its stock. Shifts in trade volume can make observed price movements more significant. Higher volume for a stock is an indicator of higher liquidity in the market. For institutional investors who wish to sell a large number of shares of a certain stock, lower liquidity will force them to sell the stock slowly over a longer period of time, to avoid losses due to slippage.
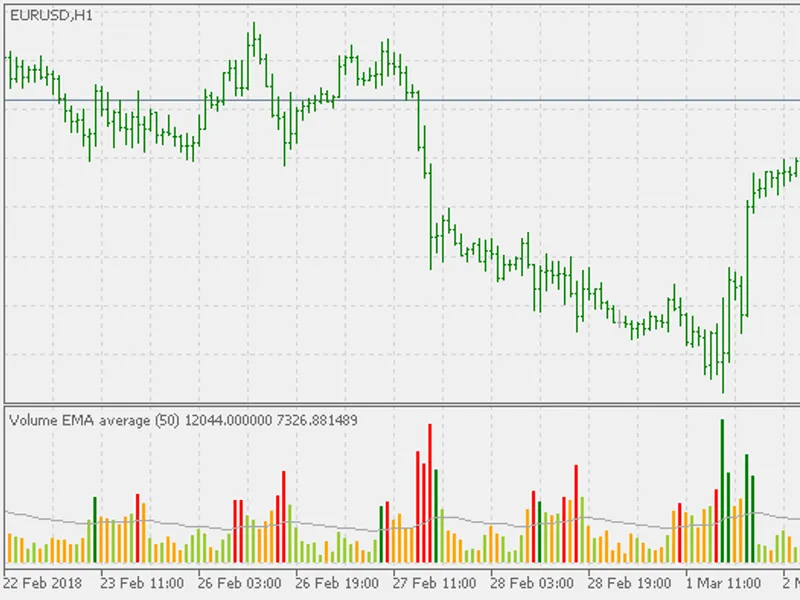
With MetaTrader 5 now you can chose if the volume used is going to be tick volumes or real volumes. Percentage breakouts compared to average volume are marked with different colors.