Variable Index Dynamic Average (VI D Y A)
This professional-grade solution for MetaTrader 5 helps traders achieve greater efficiency in their daily workflow. This technical indicator acts as a specialized analysis tool designed to visualize market data. It helps traders identify emerging trends, momentum shifts, and key support or resistance levels by plotting statistical calculations directly onto price charts.
How to Setup and Use Variable Index Dynamic Average (VI D Y A)
1. Installation: Place your file in the MQL/Indicators folder via "Open Data Folder" and restart your terminal.
2. Loading: Find the indicator in the Navigator, drag it onto your chart, and configure the input parameters in the popup window.
3. Customization: Press Ctrl+I to open the indicator list, select your tool, and click "Properties" to change colors, levels, or visual styles.
4. Updating: Replace the old file in the Indicators folder with the new version and restart the platform to apply changes.
Frequently Asked Questions
Q: Why is my indicator not showing? A: Verify the file is in the MQL/Indicators folder, or try right-clicking the "Indicators" tree in the Navigator and clicking "Refresh."
Q: Do custom indicators slow down the platform? A: Too many complex indicators can impact performance; remove unused ones via the "Indicator List" (Ctrl+I).
Q: Can I use MT4 indicators on MT5? A: No, MQL4 and MQL5 are distinct languages; ensure the indicator is compiled specifically for your platform version.
Description & Settings
Variable Index Dynamic Average (VIDYA) technical indicator was developed by Tushar Chande.
It is an original method of calculating the Exponential Moving Average (EMA) with the dynamically changing period of averaging. Period of averaging depends on the market volatility; as the measure of volatility Chande Momentum Oscillator (CMO) was chosen.
This oscillator measures the ratio between the sum of positive increments and sum of negative increments for a certain period (CMO period). CMO value is used as the ratio to the smoothing factor EMA. Thus VIDYA has to setup parameters: period of CMO and period of EMA.
Application
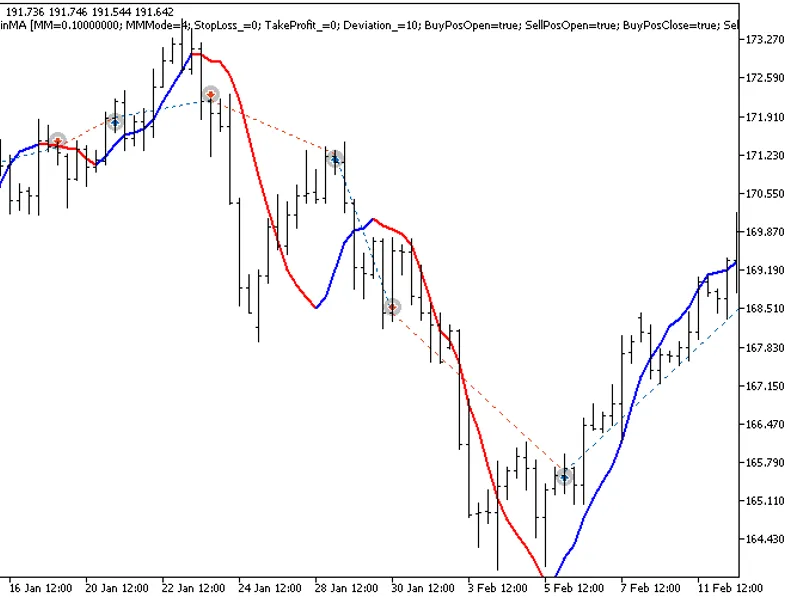
Usually not VIDYA itself is used in trading systems, but its upper and lower borders (Upper band & Lower band), that are by N% above and below VIDYA. Interpretation of the indicator for receiving trade signals in this form is performed similar to Bollinger Bands ®.
Variable Index Dynamic Average Indicator
Calculation:
The standard Exponential Moving Average is calculated according to the below formula:
EMA(i) = Price(i) * F + EMA(i-1)*(1-F)
where:
F = 2/(Period_EMA+1) - smoothing factor;
Period_EMA - EMA averaging period;
Price(i) - current price;
EMA(i-1) - previous value of EMA.
The value of Variable Index Dynamic Average is calculated in the analogous way using CMO:
VIDYA(i) = Price(i) * F * ABS(CMO(i)) + VIDYA(i-1) * (1 - F* ABS(CMO(i)))
where:
ABS(CMO(i)) - absolute current value Chande Momentum Oscillator;
VIDYA(i-1) - previous value of VIDYA.
The value of CMO is calculated according to the below formula:
CMO(i) = (UpSum(i) - DnSum(i))/(UpSum(i) + DnSum(i))
where:
UpSum(i) - current sum of positive price increments for the period;
DnSum(i) - current sum of negative price increments for the period.