Choppy Market Index
This tool for MetaTrader 5 is specifically engineered to streamline your trading operations. This technical indicator acts as a specialized analysis tool designed to visualize market data. It helps traders identify emerging trends, momentum shifts, and key support or resistance levels by plotting statistical calculations directly onto price charts.
How to Setup and Use Choppy Market Index
1. Installation: Place your file in the MQL/Indicators folder via "Open Data Folder" and restart your terminal.
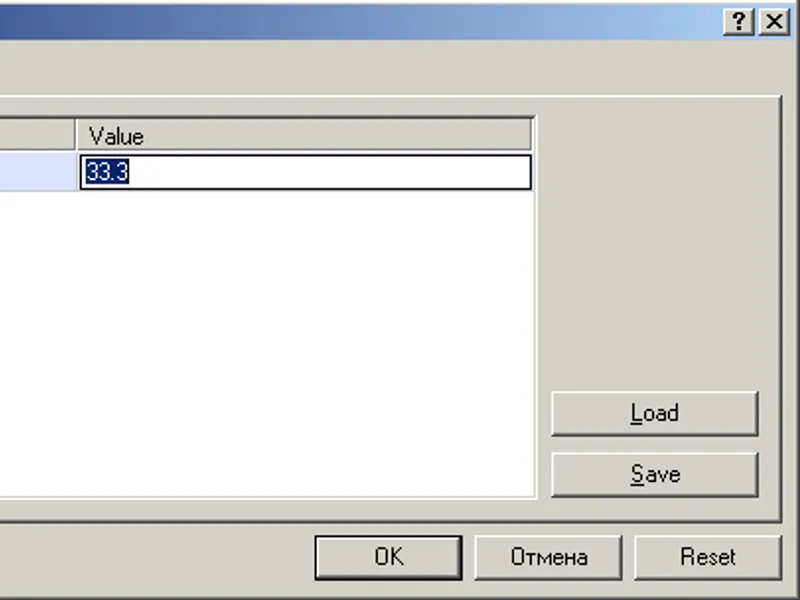
2. Loading: Find the indicator in the Navigator, drag it onto your chart, and configure the input parameters in the popup window.
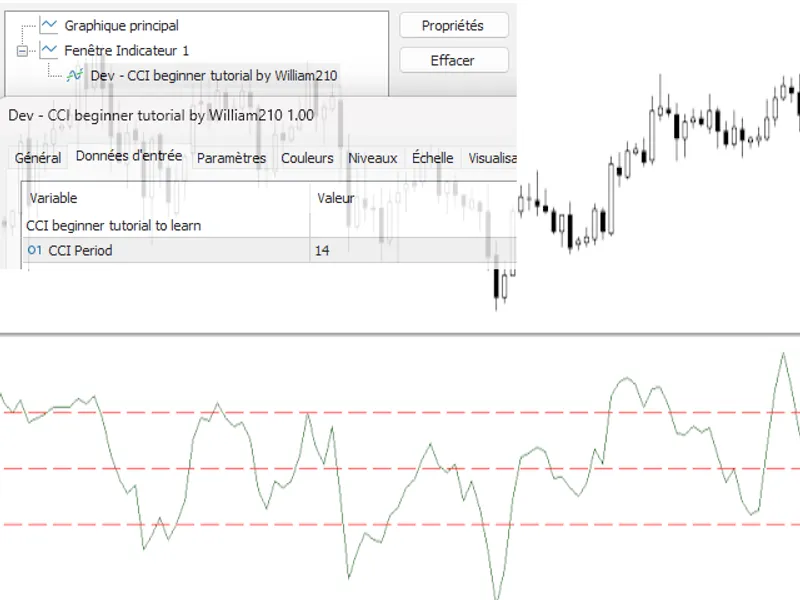
3. Customization: Press Ctrl+I to open the indicator list, select your tool, and click "Properties" to change colors, levels, or visual styles.
4. Updating: Replace the old file in the Indicators folder with the new version and restart the platform to apply changes.
Frequently Asked Questions
Q: Why is my indicator not showing? A: Verify the file is in the MQL/Indicators folder, or try right-clicking the "Indicators" tree in the Navigator and clicking "Refresh."
Q: Do custom indicators slow down the platform? A: Too many complex indicators can impact performance; remove unused ones via the "Indicator List" (Ctrl+I).
Q: Can I use MT4 indicators on MT5? A: No, MQL4 and MQL5 are distinct languages; ensure the indicator is compiled specifically for your platform version.
Description & Settings
Daniel Fernandez
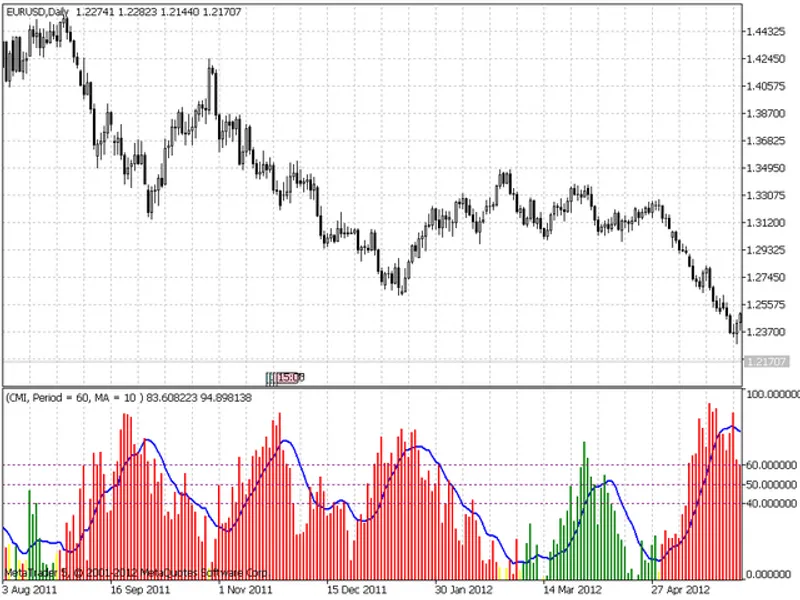
Indicator values are in the range 0-100. The greater is the indicator value, the greater is the market stability, so the more likely we have trend. The smaller is the indicator value - the less probable the trend is.
Calculation formula:
CMI = ((ABS(Close[0]-Close[n]))/(MaxHigh[n]-MinLow[n]))*100
Where:
ABS - absolute value
Close[0] - last close
Close[n] - close N bars ago
MaxHigh[n] - maximal value of High for the N bars period
MinLow[n] - minimal value of Low for the N bars period
Tips:
Trading on unstable market:
Buy, when moving average (blue line) of the CMI indicator is below 40 and the histogram is red.
Sell when moving average (blue line) of the CMI indicator is below 40 and the histogram is green.
Close positions when CMI histogram is above 50.
Trading on trend market:
Buy when moving average is above 60 and the histogram is green.
Sell when moving average is above 60 and the histogram is red.
Close positions, when CMI histogram is below 50.
This indicator can be used as a filter in trend trading strategies.