RA V I (Range Action Verification Index)
This software component for MetaTrader 5 is built to enhance the capabilities of your trading environment. This technical indicator acts as a specialized analysis tool designed to visualize market data. It helps traders identify emerging trends, momentum shifts, and key support or resistance levels by plotting statistical calculations directly onto price charts.
How to Setup and Use RA V I (Range Action Verification Index)
1. Installation: Place your file in the MQL/Indicators folder via "Open Data Folder" and restart your terminal.
2. Loading: Find the indicator in the Navigator, drag it onto your chart, and configure the input parameters in the popup window.
3. Customization: Press Ctrl+I to open the indicator list, select your tool, and click "Properties" to change colors, levels, or visual styles.
4. Updating: Replace the old file in the Indicators folder with the new version and restart the platform to apply changes.
Frequently Asked Questions
Q: Why is my indicator not showing? A: Verify the file is in the MQL/Indicators folder, or try right-clicking the "Indicators" tree in the Navigator and clicking "Refresh."
Q: Do custom indicators slow down the platform? A: Too many complex indicators can impact performance; remove unused ones via the "Indicator List" (Ctrl+I).
Q: Can I use MT4 indicators on MT5? A: No, MQL4 and MQL5 are distinct languages; ensure the indicator is compiled specifically for your platform version.
Description & Settings
Unknown
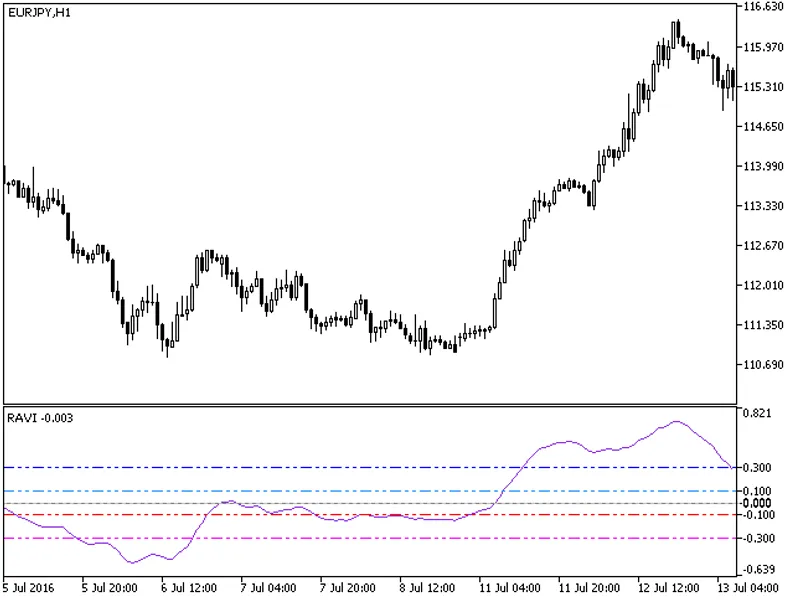
The indicator represents the relative convergence/divergence of the moving averages of the financial asset, increased a hundred times. It is based on a different principle than the ADX. Chande suggests a 13-week SMA as the basis for the indicator. It represents the quarterly (3 months = 65 working days) sentiments of the market participants concerning prices. The short moving average comprises 10% of the one and is rounded to seven.
Tushar Chande suggests the following reference lines for the RAVI indicator: plus-minus 0.3% or plus-minus 0.1% (depending on the market). When the indicator crosses the upper reference line upward, an uptrend is considered to have started. When the indicator crosses the lower reference line downward, a downtrend is considered to have started. The uptrend is considered to be continuing while the RAVI line grows. The downtrend, respectively, while the RAVI falls. As soon as the indicator reverts to the zero line, the trend is considered to have ended, and a channel is considered to have started. But if the indicator reverses again, without entering the gap between the reference lines, the trend is considered to have resumed.
Essentially, the proposed indicator is quite simple and almost identical to the Price Oscillator and MACD. The uniqueness is in the use of the price convergence-divergence value as the trend indication, paying attention to the divergence and not the crossing of the averages.
After examining the plotting method of the АDХ, it can be said that the indicator has two smoothings. RAVI has one smoothing. This makes the indicator more sensitive. With the specified values, it warns about the beginning and end of a trend earlier than an 18-day ADX.
The indicator uses SmoothAlgorithms.mqh library classes (copy it to <terminal_data_folder>\MQL5\Include). The use of the classes was thoroughly described in the article .
Originally this indicator has been written in MQL4 and was first published in the on 15.02.2008.
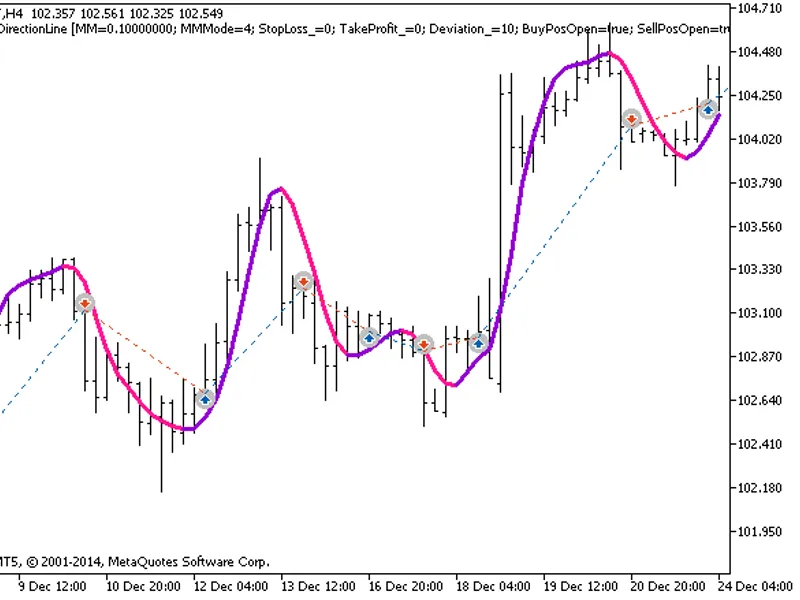
Fig.1. The RAVI indicator