
Download ALL MT5 indicators (5742)

Similar MetaTrader Tools








unity pro
Info
The unity pro is a Indicator for MetaTrader 5 that the underlying algorithm can be described in the following way. consider it on the minimalistic example with one currency pair (eurusd) and gold (xauusd).
Usage
This tool is typically used for enhancing chart analysis and decision making.
Platform
This Indicator works exclusively on MetaTrader 5 (both build 600+ and newer versions).
Setup
Place the downloaded file in MQL5/Indicators folder via File ? Open Data Folder in MetaTrader 5.
How to Install and Use unity pro
1. Installation: Place your file in the MQL/Indicators folder via "Open Data Folder" and restart your terminal.
2. Loading: Find the indicator in the Navigator, drag it onto your chart, and configure the input parameters in the popup window.
3. Customization: Press Ctrl+I to open the indicator list, select your tool, and click "Properties" to change colors, levels, or visual styles.
4. Updating: Replace the old file in the Indicators folder with the new version and restart the platform to apply changes.
Frequently Asked Questions
Q: Why is my indicator not showing? A: Verify the file is in the MQL/Indicators folder, or try right-clicking the "Indicators" tree in the Navigator and clicking "Refresh."
Q: Do custom indicators slow down the platform? A: Too many complex indicators can impact performance; remove unused ones via the "Indicator List" (Ctrl+I).
Q: Can I use MT4 indicators on MT5? A: No, MQL4 and MQL5 are distinct languages; ensure the indicator is compiled specifically for your platform version.
What this tool does
the underlying algorithm can be described in the following way.
Typical Use Case
This Indicator excels in automated trading and technical analysis on MetaTrader 5.
Compatible Platform & Setup
This Indicator works on MetaTrader 5. Place the file in the MQL5/Indicators folder and restart the terminal.
Description & Settings
Related: unity - another powerful indicator for MetaTrader 5 traders.
the underlying algorithm can be described in the following way. consider it on the minimalistic example with one currency pair (eurusd) and gold (xauusd).
Also recommended: fractal force index ht f - similar indicator with strong performance on MetaTrader 5.
at every moment, the market state (that is current prices, or open prices of the bars) is expressed by obvious relations:eur / usd = eurusd
xau / usd = xauusd
where variables eur, usd, xau are pure "values" of the assets, and eurusd, xauusd are constants (exchange rates, or quotes).
to find the variables, we supplement the system with another equation, limiting the sum of the variables to unity:
eur + xau + usd = 1
hence the name of the indicator — unity (pro).
and here is the difference from unity: while that used the sum of squares, this uses plain sum (no squares). as a result, if a user selects the mode absolutevalues (see below), any pair of lines of the indicator is related as corresponding exchange rate on every bar. for example, a value of eur and a value of usd conforms to eurusd (as a number). please, note, this only gives proper ratio when moving averaging is off, that is priceperiod is 1.
simple substitution gives:
eurusd * usd + xauusd * usd + usd = 1
then usd can be found as:
usd = 1 / (1 + eurusd + xauusd)
and all other variables can be calculated.
in general:
x0 = 1 / (1 + sum(c(xi, x0))), i = 1..n
xi = c(xi, x0) * x0, i = 1..n
where n — number of variables, c(xi,x0) — the quote of i-th pair including corresponding variables. please note, that the number of variables is 1 more than instruments.
elimination of squares and square roots improved indicator performance in comparison to unity.
since the coefficients c involved in the calculations are quotes that are usually very different, in the indicator they are additionally multiplied by contract's sizes: this gives more or less comparable values (at least, of one order). to see them "as is" in the indicator window there is an absolutevalues input parameter that should be set to true. by default, it is false, and the indicator calculates the increments of variables:
yi = xi0 / xi1 - 1,
where xi0 and xi1 are values on the last and the previous bars respectively.
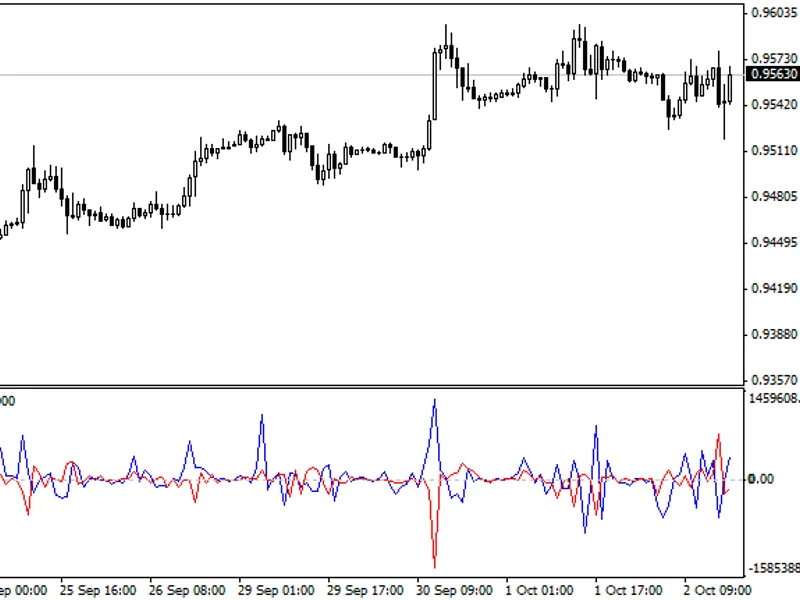
here is a screenshot for the cluster "eurusd,gbpusd,usdchf,usdjpy,audusd,usdcad,nzdusd,xauusd" in two instances of the indicator: with values and momentum (impulse):
the lines of assets that make up work symbol of the current chart (in this case, xau and usd) are shown thick, the rest are thin.
the main input parameters of the indicator:
instruments — the string with the names of work symbols separated by commas; it is necessary for all instruments to have one common currency - either base or quoting one;
barlimit — number of bars to calculate;
draw — drawing style;
pricetype — price type used in calculations;
pricemethod — moving average method;
absolutevalues — a switch: set to true to show values "as is", set to false to view changes of values;
priceperiod (new in unity pro) — moving average period, 1 means no averaging and corresponds to unity;
momentum (new in unity pro) — an option to use with absolutevalues = false only; this is a number from 0 to 1, denoting which part of acceleration to add to indicator readings; 0 means no acceleration, only change of values is shown; 1 means full (pure) acceleration, that is "change of changes" of values is shown; when momentum is 1, the indicator gives impulse signals; when momentum is 0 the signals are cumulative.
sigma1, sigma2 (new in unity pro) — 2 levels of dynamically adjusted market range, each given as a number of standard deviation of all buffers on priceperiod bars; for example, sigma1=1 means that 68% of time all values are inside the range, and sigma2=3 means 3 sigma range where all the market stays 99% of time; 2 sigmas range provides 95% presence in its boundaries.
possible strategies to trade using this indicator:
two lines mutual crossing: buy going up asset and sell going down asset; a trend;
zero crossing by lines: buy what goes above zero, sell what goes below; a possible trend;
buy (or sell) an asset which goes outside 2-3 sigmas up (or down); this is a breakthrough;
buy (or sell) an asset which goes back inside into smaller sigma down (or up) after touching higher sigma; this is a retracement or correction;
buy (or sell) on high mutual speed between lines, it also can be detected as peaks on momentum;
You may also like: trend envelopes of averages histogram - excellent alternative for indicator users on MetaTrader 5.
Source Code
#property copyright "robotfx"
#property link "https://robotfx.org"
#property version   "2.0"
#property description "this code is educational. feel free to use, modify and upgrade as you wish. visit robotfx.org for professional trading tools"
#define buf_num 19
#define sym_num 15
#property indicator_separate_window
#property indicator_buffers buf_num
#property indicator_plots buf_num
#property indicator_color1 green
.......
⚠ Limitations & Risk Warning
- This tool is provided for educational and testing purposes only.
- Past performance does not guarantee future results.
- Trading involves substantial risk of loss. Use on a demo account first.
- Results may vary depending on market conditions, broker, and settings.
- We recommend thorough backtesting and forward testing before using with real funds.