Tymen ST A R C Bands MT F
This professional-grade solution for MetaTrader 5 helps traders achieve greater efficiency in their daily workflow. This technical indicator acts as a specialized analysis tool designed to visualize market data. It helps traders identify emerging trends, momentum shifts, and key support or resistance levels by plotting statistical calculations directly onto price charts.
How to Setup and Use Tymen ST A R C Bands MT F
1. Installation: Place your file in the MQL/Indicators folder via "Open Data Folder" and restart your terminal.
2. Loading: Find the indicator in the Navigator, drag it onto your chart, and configure the input parameters in the popup window.
3. Customization: Press Ctrl+I to open the indicator list, select your tool, and click "Properties" to change colors, levels, or visual styles.
4. Updating: Replace the old file in the Indicators folder with the new version and restart the platform to apply changes.
Frequently Asked Questions
Q: Why is my indicator not showing? A: Verify the file is in the MQL/Indicators folder, or try right-clicking the "Indicators" tree in the Navigator and clicking "Refresh."
Q: Do custom indicators slow down the platform? A: Too many complex indicators can impact performance; remove unused ones via the "Indicator List" (Ctrl+I).
Q: Can I use MT4 indicators on MT5? A: No, MQL4 and MQL5 are distinct languages; ensure the indicator is compiled specifically for your platform version.
Description & Settings
It has twenty six input parameters:
Drawing mode
- indicator drawing type
Steps
- as a ladder
Slope
- sloping lines
Show middle lines
- show middle lines of Tymen STARC Bands
Show first Tymen STARC Bands
- draw the first Tymen STARC Bands indicator
First bands timeframe
- timeframe the first Tymen STARC Bands indicator
First bands ATR period
- ATR calculation period for the first Tymen STARC Bands
First bands MA period
- MA calculation period for the first Tymen STARC Bands
First bands Method
- MA type of the first Tymen STARC Bands
First bands Applied price
- MA calculation price of the first Tymen STARC Bands
First bands ATR coefficient
- external ATR period of the first Tymen STARC Bands
First bands ATR middle coefficient
- internal ATR period of the first Tymen STARC Bands
Show second Tymen STARC Bands
- draw the second Tymen STARC Bands indicator
Second bands timeframe
- timeframe the second Tymen STARC Bands indicator
Second bands ATR period
- ATR calculation period for the second Tymen STARC Bands
Second bands MA period
- MA calculation period for the second Tymen STARC Bands
Second bands Method
- MA type of the second Tymen STARC Bands
Second bands Applied price
- MA calculation price of the second Tymen STARC Bands
Second bands ATR coefficient
- external ATR period of the second Tymen STARC Bands
Second bands ATR middle coefficient
- internal ATR period of the second Tymen STARC Bands
Show third Tymen STARC Bands
- draw the third Tymen STARC Bands indicator
Third bands timeframe
- timeframe the third Tymen STARC Bands indicator
Third bands ATR period
- ATR calculation period for the third Tymen STARC Bands
Third bands MA period
- MA calculation period for the third Tymen STARC Bands
Third bands Method
- MA type of the third Tymen STARC Bands
Third bands Applied price
- MA calculation price of the third Tymen STARC Bands
Third bands ATR coefficient
- external ATR period of the third Tymen STARC Bands
Third bands ATR middle coefficient
- internal ATR period of the third Tymen STARC Bands
The types of Moving Averages, which can be used for each of the three Tymen STARC Bands:
Simple
-
Exponential
-
Smoothed
-
Linear-Weighted
-
Wilder Exponential
-
Sine-Weighted
-
Triangular
-
Least Square
-
Hull MA by Alan Hull
-
Zero-Lag Exponential
-
Instantaneous Trendline by J.Ehlers
-
Moving Median
-
Geometric Mean
-
Regularized EMA by Chris Satchwell
-
Integral of Linear Regression Slope
-
Combination of LSMA and ILRS
- moving average - combination of and methods
Triangular MA generalized by J.Ehlers
-
Volume-Weighted
-
Fig.1. Multi timeframe Tymen STARC Bands, H4, H12 and D1 data on the H1 chart, Drawing mode = Steps
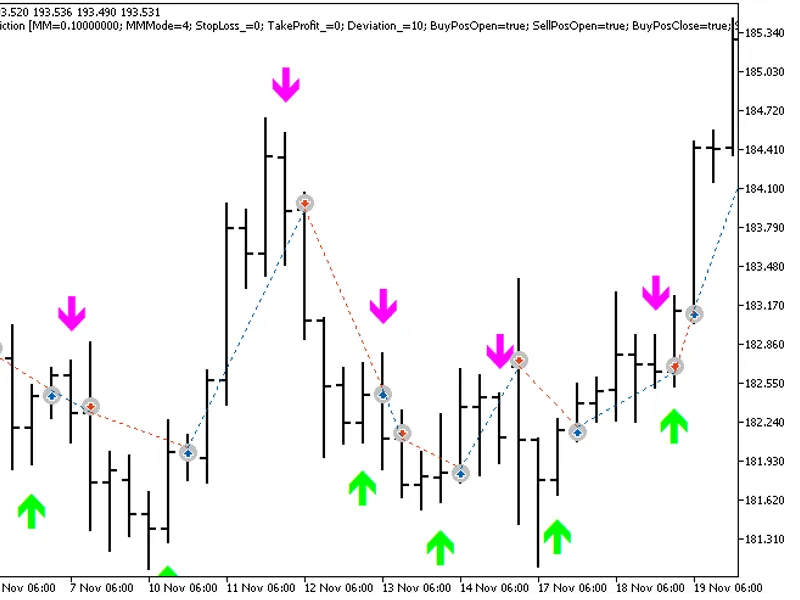
Fig.2. Multi timeframe Tymen STARC Bands, H4, H12 and D1 data on the H1 chart, Drawing mode = Slope