TW R
This professional-grade solution for MetaTrader 5 helps traders achieve greater efficiency in their daily workflow. This technical indicator acts as a specialized analysis tool designed to visualize market data. It helps traders identify emerging trends, momentum shifts, and key support or resistance levels by plotting statistical calculations directly onto price charts.
How to Setup and Use TW R
1. Installation: Place your file in the MQL/Indicators folder via "Open Data Folder" and restart your terminal.
2. Loading: Find the indicator in the Navigator, drag it onto your chart, and configure the input parameters in the popup window.
3. Customization: Press Ctrl+I to open the indicator list, select your tool, and click "Properties" to change colors, levels, or visual styles.
4. Updating: Replace the old file in the Indicators folder with the new version and restart the platform to apply changes.
Frequently Asked Questions
Q: Why is my indicator not showing? A: Verify the file is in the MQL/Indicators folder, or try right-clicking the "Indicators" tree in the Navigator and clicking "Refresh."
Q: Do custom indicators slow down the platform? A: Too many complex indicators can impact performance; remove unused ones via the "Indicator List" (Ctrl+I).
Q: Can I use MT4 indicators on MT5? A: No, MQL4 and MQL5 are distinct languages; ensure the indicator is compiled specifically for your platform version.
Description & Settings
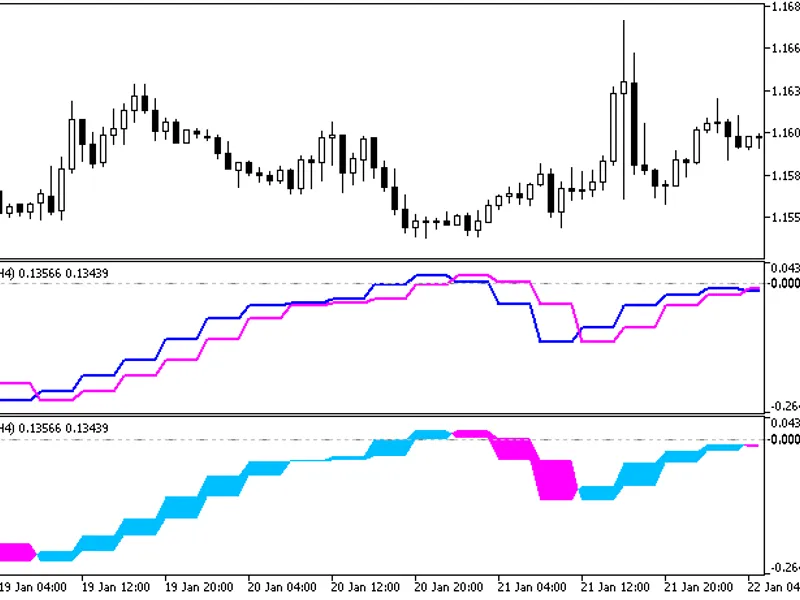
TWR is calculated based on the color of the previous bar and the closing price of the current bar, ignoring the other price information, and actually redrawing the candle chart using the closing price.
Color definition:
Red indicates a rise.
Green indicates a drop.
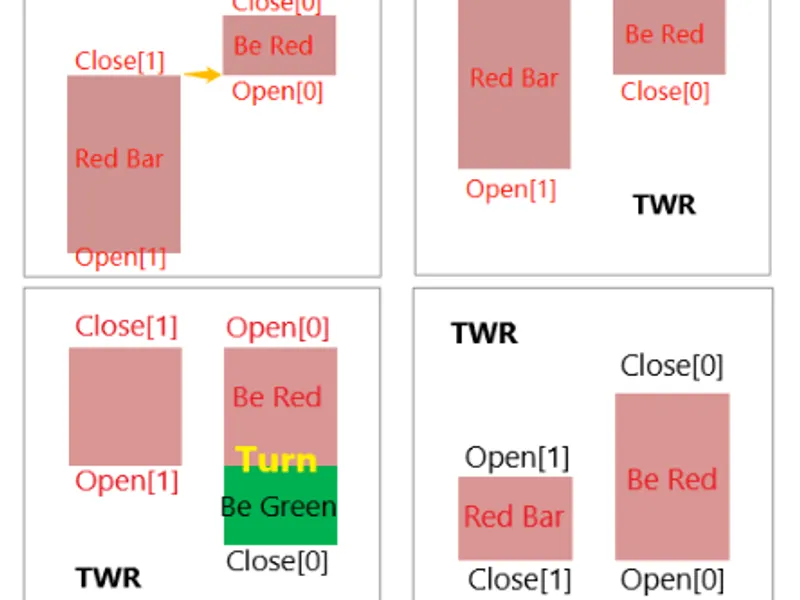
Define the color of the first bar:
Open > Close - Green; Open < Close - Red;
Note (just to help understand, the actual code's index order is the opposite):
Open[0] - the current opening price.
Close[0] - the current closing price.
Open[1] - the opening price of the previous bar.
Close[1] - the closing price of the previous bar.
The calculation principle is as follows:
1.Upward trend:
Figure 1: calculation principle of upward trend
2.Down trend:
Figure 2: calculation principle of down trend
Classic turning signal of indicators:
Figure 3: upward trend signal turn
Figure 4: downtrend signal turn
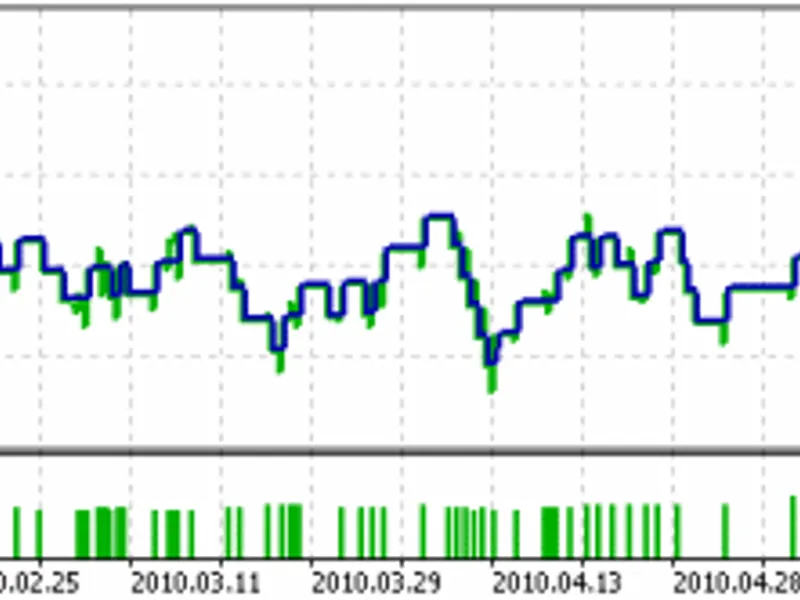
3.In fact, we can add EMA to filter the noise signal and improve the quality of the signal.
If TWR give us the trend signal, and the bar closes above the EMA or under the EMA, then the trend will be true.
Figure 5: example