TRi X
This tool for MetaTrader 5 is specifically engineered to streamline your trading operations. This technical indicator acts as a specialized analysis tool designed to visualize market data. It helps traders identify emerging trends, momentum shifts, and key support or resistance levels by plotting statistical calculations directly onto price charts.
How to Setup and Use TRi X
1. Installation: Place your file in the MQL/Indicators folder via "Open Data Folder" and restart your terminal.
2. Loading: Find the indicator in the Navigator, drag it onto your chart, and configure the input parameters in the popup window.
3. Customization: Press Ctrl+I to open the indicator list, select your tool, and click "Properties" to change colors, levels, or visual styles.
4. Updating: Replace the old file in the Indicators folder with the new version and restart the platform to apply changes.
Frequently Asked Questions
Q: Why is my indicator not showing? A: Verify the file is in the MQL/Indicators folder, or try right-clicking the "Indicators" tree in the Navigator and clicking "Refresh."
Q: Do custom indicators slow down the platform? A: Too many complex indicators can impact performance; remove unused ones via the "Indicator List" (Ctrl+I).
Q: Can I use MT4 indicators on MT5? A: No, MQL4 and MQL5 are distinct languages; ensure the indicator is compiled specifically for your platform version.
Description & Settings
Theory:
Developed by Jack Hutson in the early 1980s, the Triple Exponential Average (TRiX) is a momentum indicator used by technical traders that shows the percentage change in a triple exponentially smoothed moving average. When it is applied to triple smoothing of moving averages, it is designed to filter out price movements that are considered insignificant or unimportant. TRiX is also implemented by technical traders to produce signals that are similar in nature to the Moving Average Convergence Divergence (MACD).
It is posted mainly for two reasons:
it is not missing out the first bars values (there is no reason for that when EMA calculations are used)
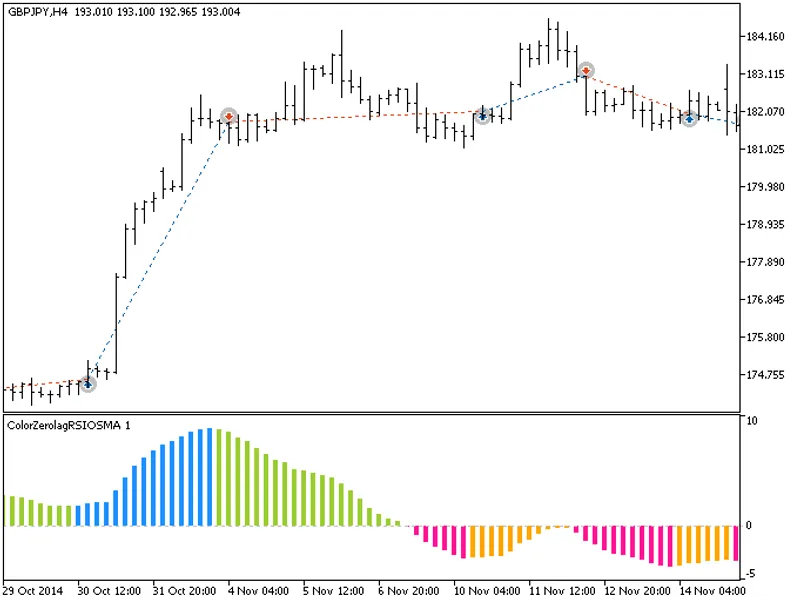
it is adding some coloring modes that can be used for easier trading decisions. You can chose to have :
color changes on slope changes
color changes on zero line cross
Usage:
You can use color changes or zero crosses as signals.