Trend Risk Indicator
This software component for MetaTrader 5 is built to enhance the capabilities of your trading environment. This technical indicator acts as a specialized analysis tool designed to visualize market data. It helps traders identify emerging trends, momentum shifts, and key support or resistance levels by plotting statistical calculations directly onto price charts.
How to Setup and Use Trend Risk Indicator
1. Installation: Place your file in the MQL/Indicators folder via "Open Data Folder" and restart your terminal.
2. Loading: Find the indicator in the Navigator, drag it onto your chart, and configure the input parameters in the popup window.
3. Customization: Press Ctrl+I to open the indicator list, select your tool, and click "Properties" to change colors, levels, or visual styles.
4. Updating: Replace the old file in the Indicators folder with the new version and restart the platform to apply changes.
Frequently Asked Questions
Q: Why is my indicator not showing? A: Verify the file is in the MQL/Indicators folder, or try right-clicking the "Indicators" tree in the Navigator and clicking "Refresh."
Q: Do custom indicators slow down the platform? A: Too many complex indicators can impact performance; remove unused ones via the "Indicator List" (Ctrl+I).
Q: Can I use MT4 indicators on MT5? A: No, MQL4 and MQL5 are distinct languages; ensure the indicator is compiled specifically for your platform version.
Description & Settings
The Trend Risk indicator finds trendy parts of the price movement and indicates the trend presence by a value in the buffer.
Can be used for flat trading - to disable trading when there is a possibility of price exiting the channel, in which trades are performed. During trend trading, the indicator can determine areas where the trend can be exhausted or it can slow down.
It has two input parameters:
Bands range
- bands calculation range
Deviation
- the deviation value (the width of the allowed channel)
Calculation:
where:
Signals:
If Close > Top
If Close < Bottom
The indicator displays colored Japanese candlesticks in a separate window - bullish ones are
green
, bearish ones are
red
. If a candlestick closes outside the channel formed by the bands, the candlesticks are colored in
gray
, and a value corresponding to the value of the broken channel line is added to the indicator signal buffer, which allows to determine the breakout direction from Expert Advisors and to limit trading in this or that direction, in accordance with the trading system used.
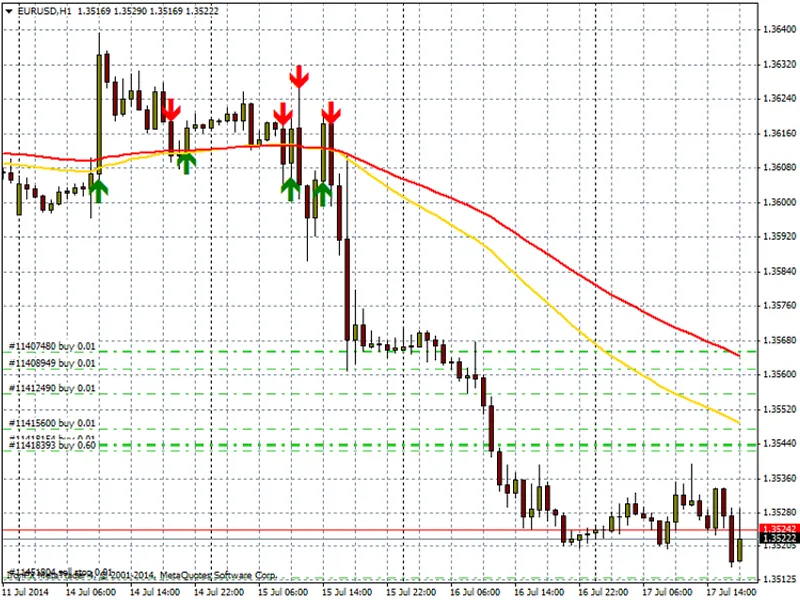
Fig. 1. Trading in the flat channel: Bands range = 12, Deviation = 1.8
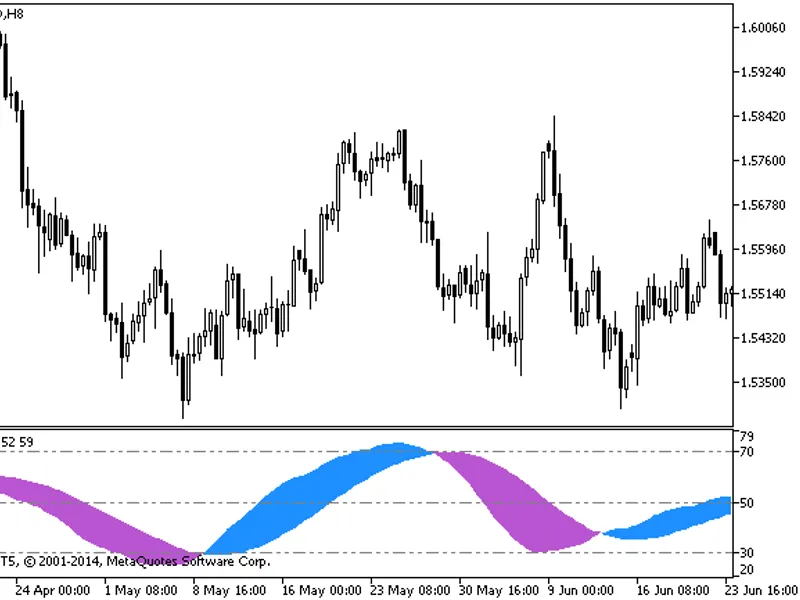
Fig. 2. Trend trading (limitation): Bands range = 23, Deviation = 6.0