Total Power Indicator
This professional-grade solution for MetaTrader 5 helps traders achieve greater efficiency in their daily workflow. This technical indicator acts as a specialized analysis tool designed to visualize market data. It helps traders identify emerging trends, momentum shifts, and key support or resistance levels by plotting statistical calculations directly onto price charts.
How to Setup and Use Total Power Indicator
1. Installation: Place your file in the MQL/Indicators folder via "Open Data Folder" and restart your terminal.
2. Loading: Find the indicator in the Navigator, drag it onto your chart, and configure the input parameters in the popup window.
3. Customization: Press Ctrl+I to open the indicator list, select your tool, and click "Properties" to change colors, levels, or visual styles.
4. Updating: Replace the old file in the Indicators folder with the new version and restart the platform to apply changes.
Frequently Asked Questions
Q: Why is my indicator not showing? A: Verify the file is in the MQL/Indicators folder, or try right-clicking the "Indicators" tree in the Navigator and clicking "Refresh."
Q: Do custom indicators slow down the platform? A: Too many complex indicators can impact performance; remove unused ones via the "Indicator List" (Ctrl+I).
Q: Can I use MT4 indicators on MT5? A: No, MQL4 and MQL5 are distinct languages; ensure the indicator is compiled specifically for your platform version.
Description & Settings
earnforex
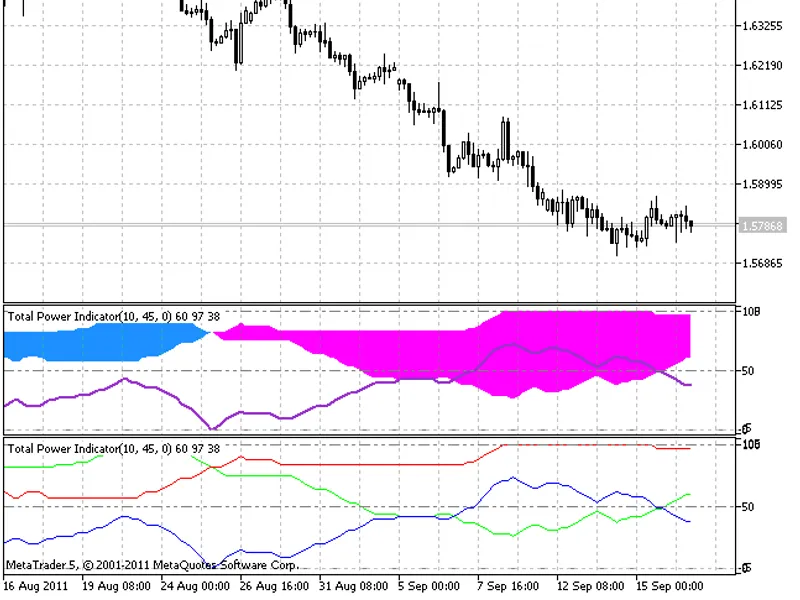
Total Power Indicator is based on two standard indicators: and .
The indicator calculates the number of bullish and bearish trend bars within a certain amount of time and then determines proportional relation of bears, bulls and the total one for the current bar (the total relation is calculated as the difference between bulls and bears).
Input parameters:
LookbackPeriod
(by default = 45) - basic indicator period. Determines the number of bars for calculation of bullish/bearish prevalence.
PowerPeriod
(by default = 10) - and original indicators period.
There are several different ways to use this indicator:
The most reliable (though also the most slow) method is to wait while the Bullish (or Bearish in case of selling) and Total lines indicate 100 and then open a long position (or a short one if it was the Bearish line).
Bearish and Bullish lines crossing can also be used for trading. In case the Bullish line is located above the Bearish one after the crossing, then it is time to buy, in case of a reverse situation, a short position must be opened.
Crossing of Bullish and Bearish lines with the Total one can be used both for market entry and exit. If the Bullish line crosses the Total one from below, it is time to open a long position, if the Bearish line crosses the Total one from below, a short position must be opened. If the lines cross the Total one from above, it is the very time to close the appropriate position.
The alternative way is to use some definite indicator levels instead of the lines crossings. For example, a long/short position can be opened, if the Bullish/Bearish line moves above level 66.