Three Line Break
This software component for MetaTrader 5 is built to enhance the capabilities of your trading environment. This technical indicator acts as a specialized analysis tool designed to visualize market data. It helps traders identify emerging trends, momentum shifts, and key support or resistance levels by plotting statistical calculations directly onto price charts.
How to Setup and Use Three Line Break
1. Installation: Place your file in the MQL/Indicators folder via "Open Data Folder" and restart your terminal.
2. Loading: Find the indicator in the Navigator, drag it onto your chart, and configure the input parameters in the popup window.
3. Customization: Press Ctrl+I to open the indicator list, select your tool, and click "Properties" to change colors, levels, or visual styles.
4. Updating: Replace the old file in the Indicators folder with the new version and restart the platform to apply changes.
Frequently Asked Questions
Q: Why is my indicator not showing? A: Verify the file is in the MQL/Indicators folder, or try right-clicking the "Indicators" tree in the Navigator and clicking "Refresh."
Q: Do custom indicators slow down the platform? A: Too many complex indicators can impact performance; remove unused ones via the "Indicator List" (Ctrl+I).
Q: Can I use MT4 indicators on MT5? A: No, MQL4 and MQL5 are distinct languages; ensure the indicator is compiled specifically for your platform version.
Description & Settings
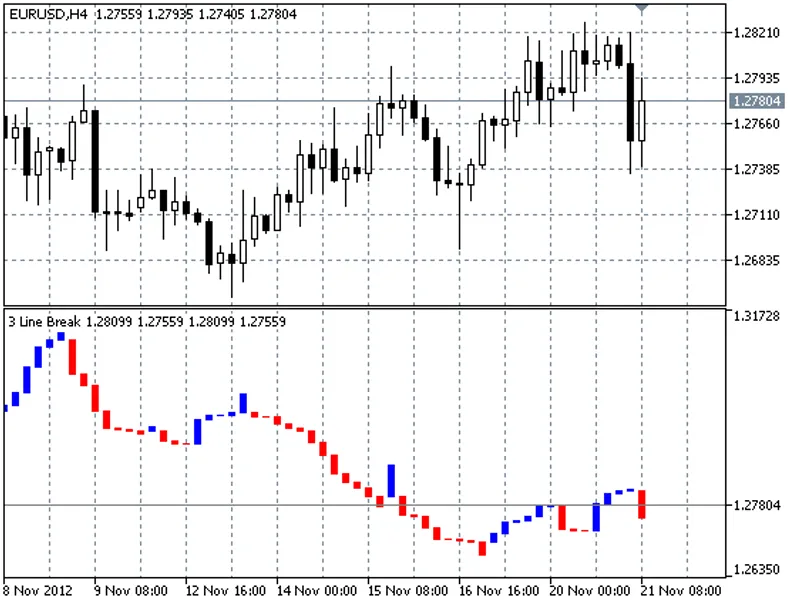
The charts of linear reversal represent a series of vertical boxes (lines) which direction and size are determined by dynamics of prices. This type of charts is drawn on close prices and considers neither timeframe, nor volume.
The main advantage is lack of a freely defined reversal value as far as it is signaled by the market behavior. The chart sensitivity of the three linear breakthrough can be regulated by changing number of lines that market should break to design the reversal.
Recommendations:
The general recommendation is a buy after appearance of a blue box after a series of red boxes, and a sell after appearance of a red box after a series of blue boxes. However, as in many cases, brute force solution of task will be optimal. Therefore, in my opinion it is better to use a linear breakthrough in combination with other instruments and find their own patterns (in TLB charts).