Three Candles
This professional-grade solution for MetaTrader 5 helps traders achieve greater efficiency in their daily workflow. This technical indicator acts as a specialized analysis tool designed to visualize market data. It helps traders identify emerging trends, momentum shifts, and key support or resistance levels by plotting statistical calculations directly onto price charts.
How to Setup and Use Three Candles
1. Installation: Place your file in the MQL/Indicators folder via "Open Data Folder" and restart your terminal.
2. Loading: Find the indicator in the Navigator, drag it onto your chart, and configure the input parameters in the popup window.
3. Customization: Press Ctrl+I to open the indicator list, select your tool, and click "Properties" to change colors, levels, or visual styles.
4. Updating: Replace the old file in the Indicators folder with the new version and restart the platform to apply changes.
Frequently Asked Questions
Q: Why is my indicator not showing? A: Verify the file is in the MQL/Indicators folder, or try right-clicking the "Indicators" tree in the Navigator and clicking "Refresh."
Q: Do custom indicators slow down the platform? A: Too many complex indicators can impact performance; remove unused ones via the "Indicator List" (Ctrl+I).
Q: Can I use MT4 indicators on MT5? A: No, MQL4 and MQL5 are distinct languages; ensure the indicator is compiled specifically for your platform version.
Description & Settings
Literally, the condition is as follows:
If there is a growing candlestick followed by another growing candle, which does not go beyond the shadow of the previous candlestick, and the second candlestick is followed by a falling candlestick, the body of which exceeds the size of the previous growing candlestick, we assume that there will be a reversal toward the SELL direction.
If there is a falling candlestick followed by another falling candle, which does not go beyond the shadow of the previous candlestick, the third candlestick should be rising and its body should exceed the body of the previous falling candlestick, we assume that there will be a reversal toward the BUY direction.
In addition to analyzing candlesticks, the indicator also analyzes tick volumes — increase, decrease, as well as the size of the first candlestick. If the size of the first candlestick in the pattern exceeds the value in pips specified in the settings, then the volume analyzer is turned off.
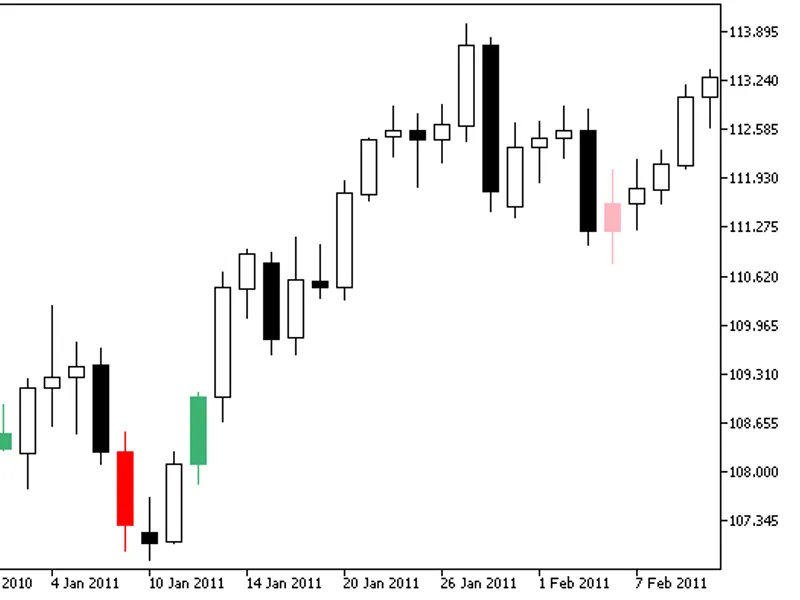
The indicator is presented as colored candlesticks. The color is bright if a candlestick goes in trend direction, and is pale if against the trend.
This indicator was first implemented in MQL4 and published in the on 04.10.2016.
Fig1. The ThreeCandles indicator