T3 floating levels
This is a powerful addition to your MetaTrader 5 toolkit designed to optimize market analysis and performance. This technical indicator acts as a specialized analysis tool designed to visualize market data. It helps traders identify emerging trends, momentum shifts, and key support or resistance levels by plotting statistical calculations directly onto price charts.
How to Setup and Use T3 floating levels
1. Installation: Place your file in the MQL/Indicators folder via "Open Data Folder" and restart your terminal.
2. Loading: Find the indicator in the Navigator, drag it onto your chart, and configure the input parameters in the popup window.
3. Customization: Press Ctrl+I to open the indicator list, select your tool, and click "Properties" to change colors, levels, or visual styles.
4. Updating: Replace the old file in the Indicators folder with the new version and restart the platform to apply changes.
Frequently Asked Questions
Q: Why is my indicator not showing? A: Verify the file is in the MQL/Indicators folder, or try right-clicking the "Indicators" tree in the Navigator and clicking "Refresh."
Q: Do custom indicators slow down the platform? A: Too many complex indicators can impact performance; remove unused ones via the "Indicator List" (Ctrl+I).
Q: Can I use MT4 indicators on MT5? A: No, MQL4 and MQL5 are distinct languages; ensure the indicator is compiled specifically for your platform version.
Description & Settings
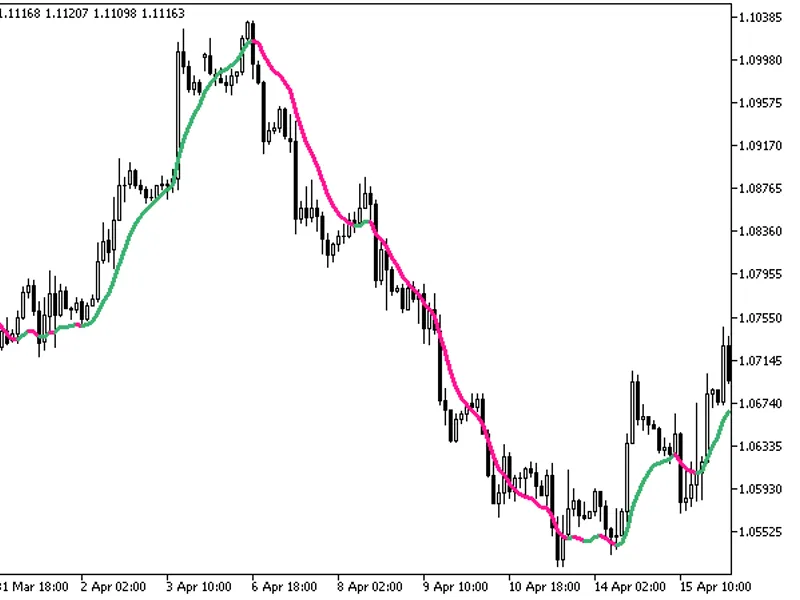
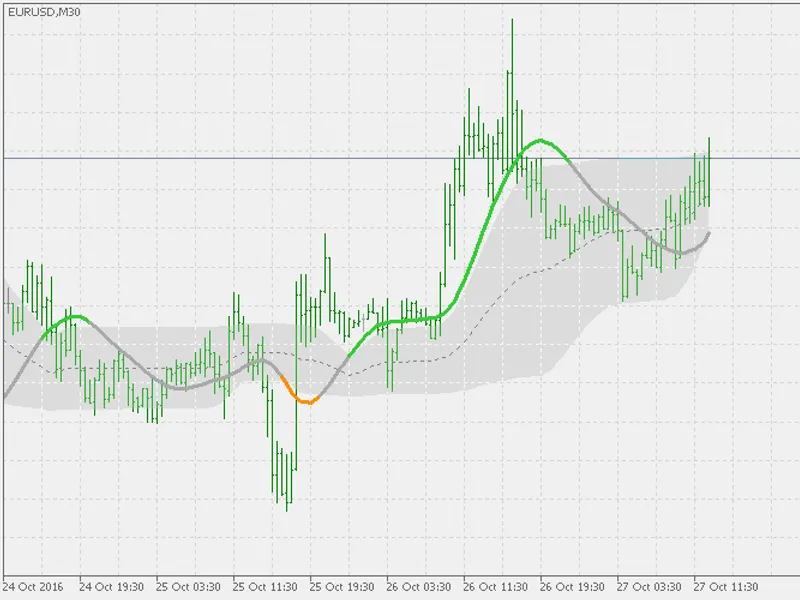
T3 indicator that is using floating levels as an aid to determine the trend
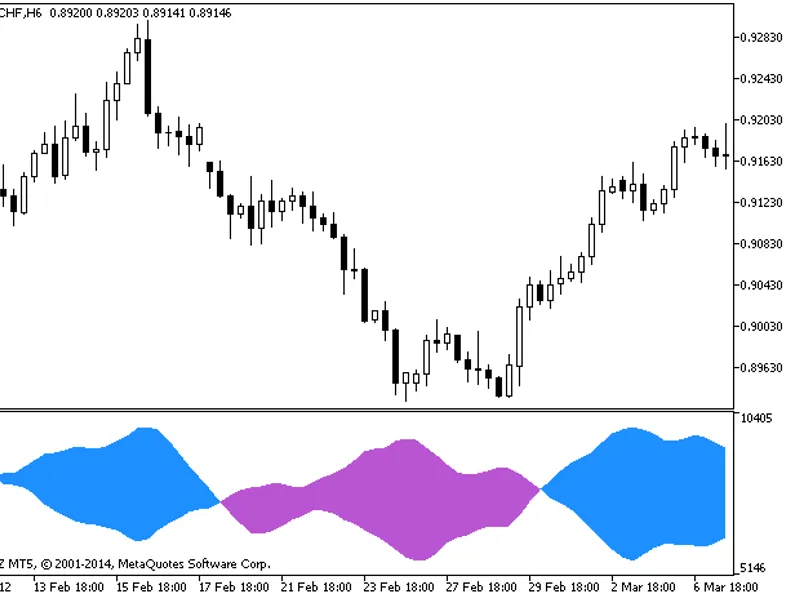
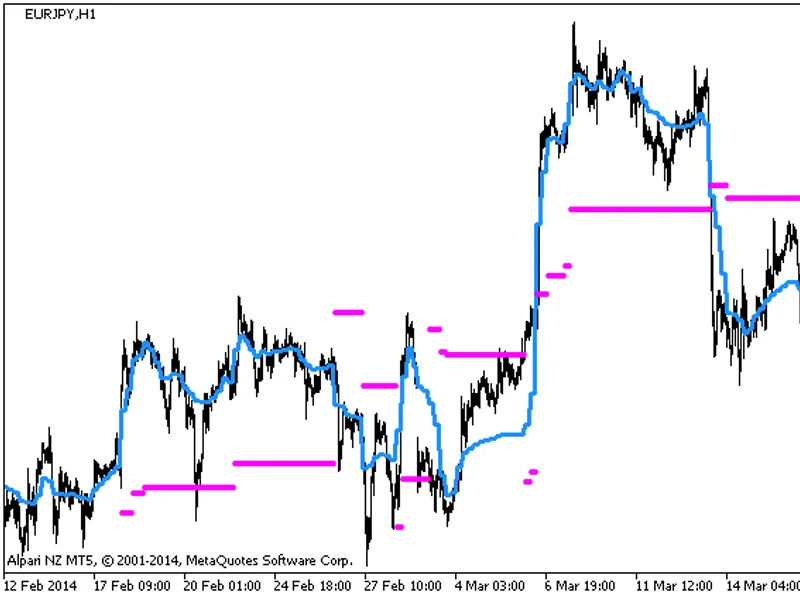
Indicator is made to be using extended set (22 types) of prices, and since it is using floating levels, it can change colors (and alert accordingly), using 3 different conditions :
when outer levels are crossed
when middle (zero) level is crossed
when the slope of T3 changes
With the addition of floating levels, the T3 usage can be extended to what it is normally used (as a kind of average). Floating levels are making it a kind of an "on chart oscillator" and then it can be used with floating "significant levels of what is usually referred to as "over bought" and "over sold" levels, but the recommendation is not to use them in that way, but as a signal for a new trend forming or a previously established trend confirmation