Swingchart
This professional-grade solution for MetaTrader 5 helps traders achieve greater efficiency in their daily workflow. This technical indicator acts as a specialized analysis tool designed to visualize market data. It helps traders identify emerging trends, momentum shifts, and key support or resistance levels by plotting statistical calculations directly onto price charts.
How to Setup and Use Swingchart
1. Installation: Place your file in the MQL/Indicators folder via "Open Data Folder" and restart your terminal.
2. Loading: Find the indicator in the Navigator, drag it onto your chart, and configure the input parameters in the popup window.
3. Customization: Press Ctrl+I to open the indicator list, select your tool, and click "Properties" to change colors, levels, or visual styles.
4. Updating: Replace the old file in the Indicators folder with the new version and restart the platform to apply changes.
Frequently Asked Questions
Q: Why is my indicator not showing? A: Verify the file is in the MQL/Indicators folder, or try right-clicking the "Indicators" tree in the Navigator and clicking "Refresh."
Q: Do custom indicators slow down the platform? A: Too many complex indicators can impact performance; remove unused ones via the "Indicator List" (Ctrl+I).
Q: Can I use MT4 indicators on MT5? A: No, MQL4 and MQL5 are distinct languages; ensure the indicator is compiled specifically for your platform version.
Description & Settings
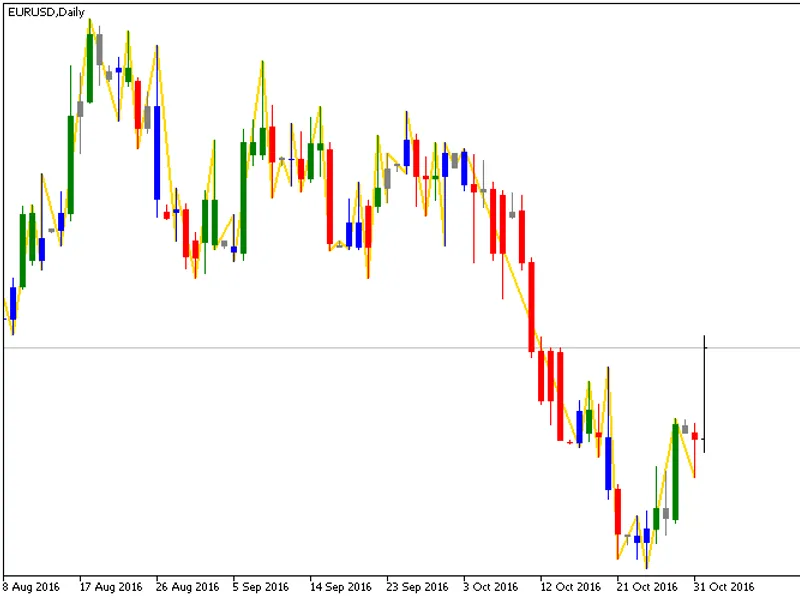
W.D. Gann was a famous trader who developed several technical analysis tools and techniques. One of these tools was the swing-chart, which can be used to identify the trend as well as to trade with it. A swing chart is constructed by first coloring the bars in comparison to their preceding bar as follows:
Green a.k.a. "Up-day" if the bar has a higher high and higher low.
Red a.k.a. "Down-day" if the bar has a lower low and lower high.
Blue a.k.a. "Outside-day" if the bar has a higher high and lower low.
Grey a.k.a. "Inside-day" or "Harami" if the bar has a lower high and higher low.
After coloring the bars as such, a ZigZag can be drawn with peaks where the colors change from green to red and troughs where the color changes from red to green.
This implementation takes care of the corner cases in the description (e.g. defining an Upday as a day where the high is higher and the low is higher or equal) and makes sure that the ZigZag obtained has price maximums and minimums on the peaks and troughs. It does not redraw previous swings, but several new peaks and troughs can come in a "burst" in the case of several inside-days and up/down-days without a new high/low.
Trading System:
The trading system associated with this (and ZigZag in general) indicator is as follows:
When a peak has formed, set buy stop above the last peak if it was higher than the next-to-last peak. Stop loss is set below the trough. In the image, one would have a buy stop on the high of the rightmost green bar, a stop loss on the low of the next red bar - and in this case be in profits already.
When a trough has formed, sell stop below last trough if it was lower than the next-to-last trough. Stop loss is set above the peak.
Comparison to Other ZigZags:
When it comes to a ZigZag for use in technical analysis, EAs and indicators, there are some desirable properties which include:
The ZigZag should not redraw the previous peaks and troughs as new bars come in.
The ZigZag should find significant peaks and troughs and ignore irrelevant ones.
A ZigZag segment should define the maximum and minimum price on that segment.
The standard ZigZag draws nicely formed swings but is known to be able to redraw itself. Therefore it is not as useful for trading as it is for analyzing past price series. The (and ZigZags like it) work by defining retracement size and considers price only. If set too high, many significant peaks and troughs can be skipped, and if set too low there can be irrelevant peaks and troughs. The Swingchart ZigZag can be seen as a mid-point between these two, not redrawing itself but also capable of considering a dynamic price range. Its main advantage is that it finds all relevant peaks and troughs and can be used in other applications which require a fine-grained peak/trough ordering.